

GBP/USD: intra-day bearish with the ranging. The pair is located to be below 100 period SMA (100 SMA) and 200 period SMA (200 SMA) within the following reversal support/resistance levels:
- 1.5401 resistance level located above 100 SMA/200 SMA in the bullish area of the chart, and
- 1.5026 support level located below 100 SMA/200 SMA in the bearish area.
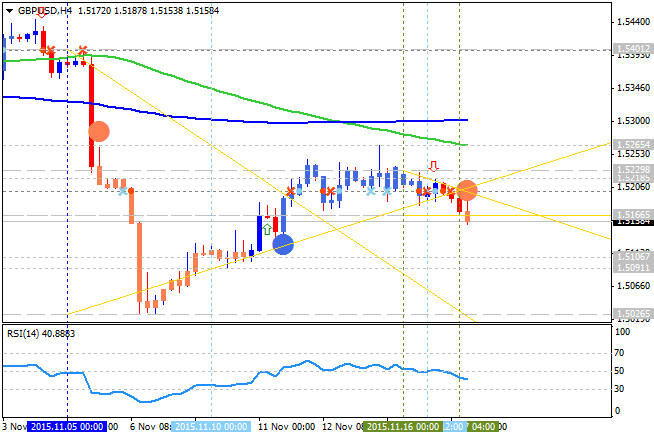
RSI indicator is estimating the bearish trend to be continuing by direction.
- if the price breaks 1.5265 resistance so the reversal of the price movement from the primary bearish to the primary bullish condition will be started;
- if the price breaks 1.5401 resistance so the price will be fully reversed to the bullish market condition;
- if the price breaks 1.5026 support level so the bearish trend will be continuing without ranging;
- if not so the price will be moved within the channel.
| Resistance | Support |
|---|---|
| 1.5265 | 1.5106 |
| 1.5401 | 1.5026 |


