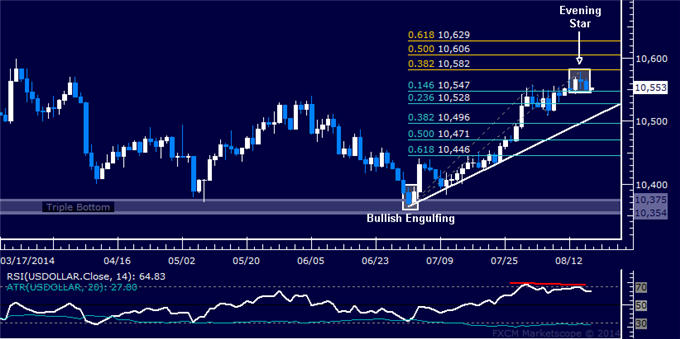
US DOLLAR TECHNICAL ANALYSIS
Prices turned lower as expected,
completing a bearish Evening Star candlestick pattern and hinting at
further losses ahead. Negative RSI divergence bolsters the case for a
downward scenario. A daily close below the 14.6%Fibonacci retracement at
10547 exposes the 23.6% level at 10528. Alternatively, a move above the
38.2% Fib expansion at 10582 opens the door for a challenge of the 50%
threshold at 10606.
S&P 500 TECHNICAL ANALYSIS
Prices declined as expected
after putting in a bearish Evening Star candlestick pattern. A bounce
following a test of the 1900.00 figure sees prices aiming for resistance
at 1968.40, the 76.4% Fibonacci retracement, with a close above that
targeting the July 24 high at 1991.40. Alternatively, a turn below the
61.8% Fib at 1954.20 aims for the 50% retracement at 1942.80.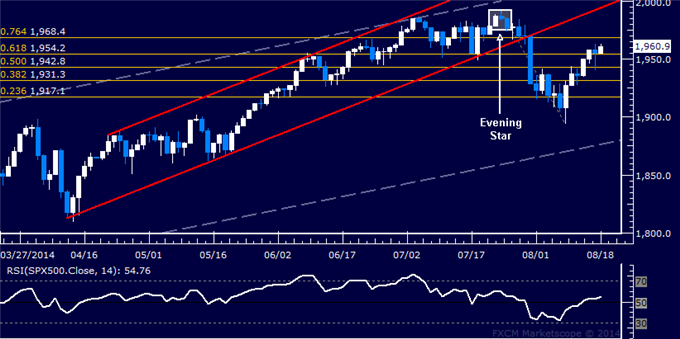
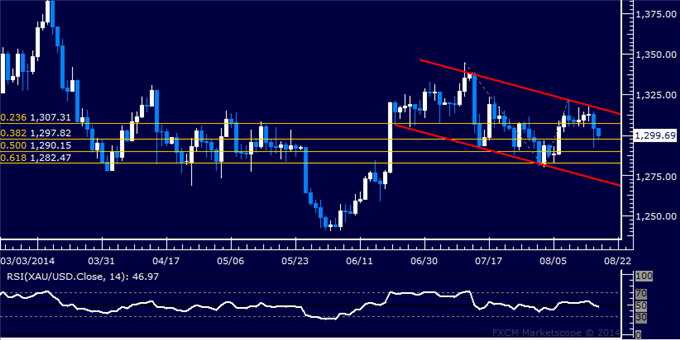
GOLD TECHNICAL ANALYSIS
Prices turned lower anew, with sellers
testing the 38.2% Fibonacci expansion at 1297.82. A break below this
barrier on a daily closing basis exposes the 50% level at 1290.15.
Alternatively, a reversal back above the 23.6% Fib at 1307.31 aims for
the channel top at 1316.54.
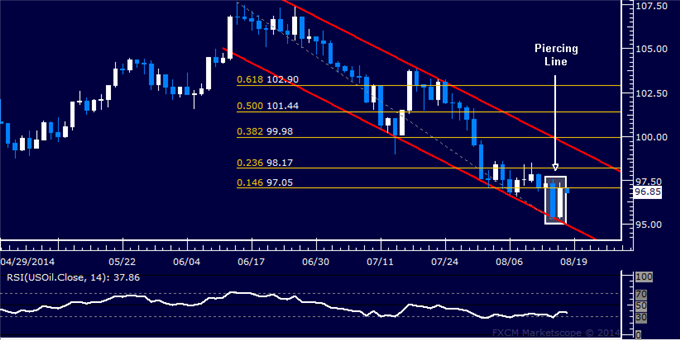
CRUDE OIL TECHNICAL ANALYSIS
Prices put in a bullish Piercing
Line candlestick pattern, hinting a rebound is ahead. Near-term
resistance is at 97.05, the 14.6% Fibonacci retracement. A daily close
above this barrier exposes the 23.6% level at 98.17. Initial support is
at 95.24, the August 14 low.