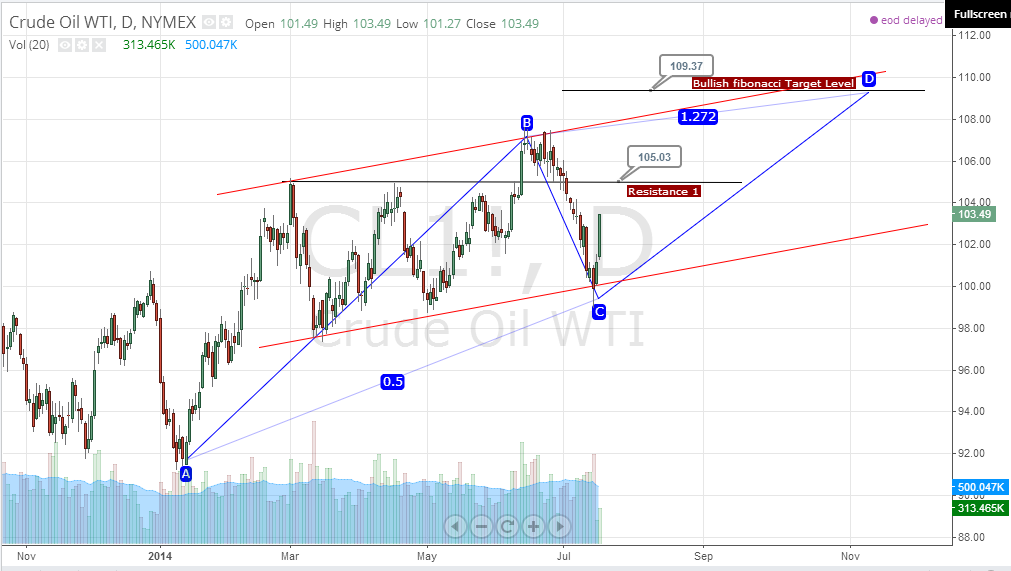
All Blogs / Analytics & Forecasts / Weekly Trends All Blogs Analytics & ForecastsWeekly TrendsForecastsTrading SystemsMy TradingChartsTrading StrategiesStatisticsTrading IdeasScalpingNeural NetworksWave CountMarket NewsCurrencyMetalsCrude OilCompany NewsEventsBanksBrokersLaw/RegulationsOther Rules Weekly Trends Technical Analysis Crude Oil, 18 July 17 July 2014, 22:48 Dian Kemala 0 100 CL found support level at fibonacci 50% inside channel up pattern. 105.03 will be resistance level, and if this level break Ideal target for this ABCD at level 109.37. To add comments, please log in or register FIBONACCI IN THE FOREX MARKET Analytics & Forecasts 55 0 Abiroid HT Scalper Arrows and Scanner Analytics & Forecasts 65 0 Should I Stop Loss Manually or Wait For Expert Advisor? Analytics & Forecasts 99 0 2 Forex Live Session Using "Supply Demand EA ProBot" (12/6/2024) Analytics & Forecasts 62 0 1 How to start using the MiloBot PRO? 🤔 Trading Systems 59 0 S&P 500, Nasdaq hit new highs: What to expect from Fed meeting, CPI data Analytics & Forecasts 65 0 How do we classify news that causes a noticeable change in prices and news that does not cause a change ? Analytics & Forecasts 71 0 Investors disappointed as no U.S. rate cut expected Analytics & Forecasts 67 0 MetaTrader 4 LiveUpdate: old version, try to download new one (How-to Avoid This) Other 52 0 65 Abiroid HT Scalper Arrows and Scanner 52 MetaTrader 4 LiveUpdate: old version, try to download new one (How-to Avoid This) 257 Pips Harvester EA FAQ how its work technical analysis gold eurusd EUR/USD Fed forex forex news GBP/USD usd/jpy ECB Trading crude oil metals Ichimoku China S&P 500 fundamental analysis Mql5 News AUD/USD Mql5 Signals forecast news Mql5 Analysis VistaBrokers stocks usd gbpusd usdjpy bitcoin support


")
