Technical Analysis for US Dollar, S&P 500, Gold and Crude Oil - S&P 500 Coiling Up for a Breakout Below 2100 Figure, Crude Oil at 5-Week High

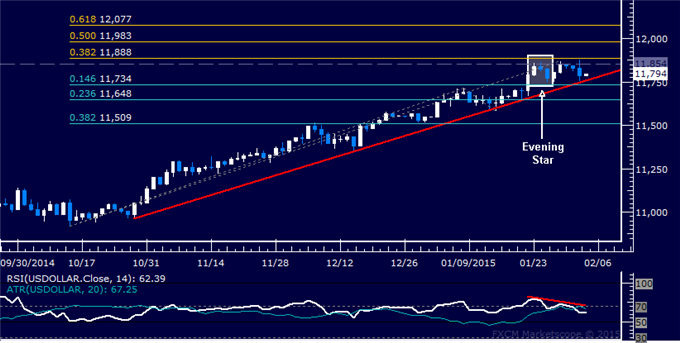
US DOLLAR TECHNICAL ANALYSIS
Prices may be readying to turn
lower after producing a bearish Evening Star candlestick pattern.
Negative RSI divergence reinforces the case for a downside scenario. A
daily close below the intersection of the 14.6% Fibonacci retracement
and a rising trend line at 11734 exposes the 23.6% level at 11648.
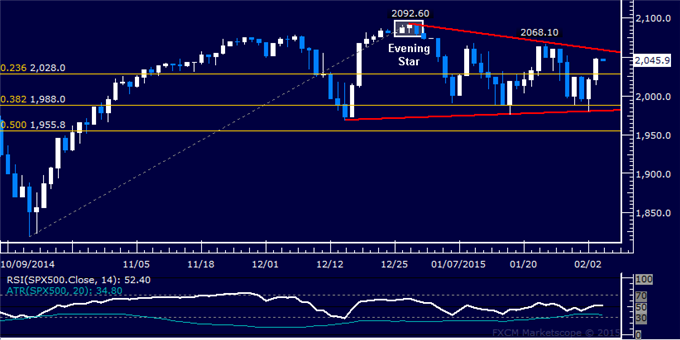
S&P 500 TECHNICAL ANALYSIS
Prices declined as expected
after putting in a bearish Evening Star candlestick pattern. A daily
close below the 23.6% Fibonacci retracement at 2028.00 exposes the
1980.60-88.00 area marked by the 38.2% level and a Triangle pattern
floor.
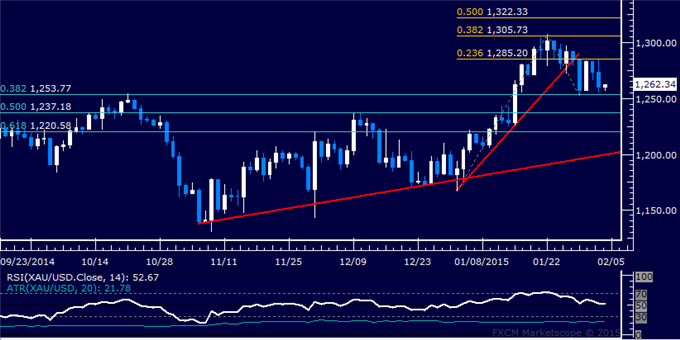
GOLD TECHNICAL ANALYSIS
Prices are consolidating above
resistance-turned-support at October’s swing highs. A daily close above
the 23.6% Fibonacci expansion at 1285.20 exposes the 38.2% level at
1305.73. Alternatively, a reversal below the 38.2% Fib retracement at
1253.77 targets the 50% threshold at 1237.18.
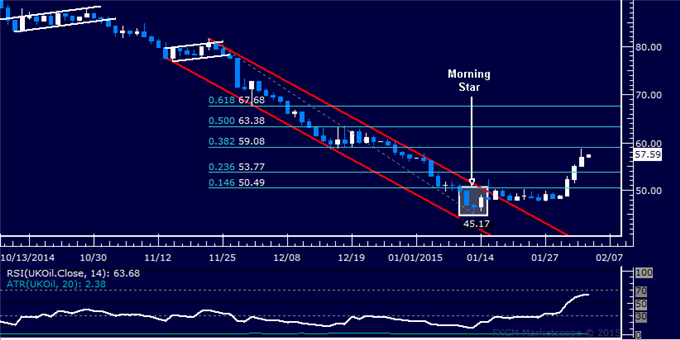
CRUDE OIL TECHNICAL ANALYSIS
Prices pushed higher following a
prolonged period of consolidation after bottoming as expected above the
$45.00/barrel figure. A daily close above the 38.2% Fibonacci
retracement at 59.08 exposes the 50% level at 63.38. Alternatively, a
reversal below the 23.6% Fib at 53.77 targets the 14.6% retracement at
50.49.