Custom Indicators (Part 1): A Step-by-Step Introductory Guide to Developing Simple Custom Indicators in MQL5
Introduction
Visual representation of market information is the cornerstone of trading. Without this visual modeling of market data and prices, trading would not be as viable or effective. From the early days of charting to the sophisticated technical analysis tools available today, traders have relied on visual cues to make informed decisions in the financial markets.
MQL5 indicators serve as powerful tools for enhancing this visual analysis process. By leveraging mathematical calculations and algorithms, MQL5 indicators help traders identify profit-making opportunities by statistically reading market behavior. These indicators can be applied directly to price charts, providing traders with valuable insights into market dynamics.
In this article series, we'll explore how MQL5 indicators are created, customized, and utilized to enhance trading strategies in MetaTrader 5. From basic indicator logic to advanced customization options, we'll cover the basics and gradually move deeper into the more advanced concepts of indicator development as we progress with the article series. The main aim of this article series is to empower you to create your own MQL5 custom indicators tailored to your trading preferences and goals.
What is an Indicator?
An indicator is a tool or instrument used to analyze past price data and forecast future price movements. Indicators mainly focus on market data analysis rather than executing trades. They cannot open, modify, or close positions and orders. They only provide insights and do not execute trades.
At their core, indicators are mathematical calculations or algorithms applied to historical price data to generate visual representations of market behavior while updating their status on real-time data as it gets updated.
These visual representations can take various forms, including line graphs, candlesticks, histograms, arrows, or overlays on price charts. Indicators help traders interpret market dynamics by highlighting trends, identifying potential reversals, or signaling overbought or oversold conditions.
Indicators can be classified into different categories based on their functionality, such as trend-following indicators, momentum indicators, volatility indicators, and volume indicators.
Types of Indicators in MQL5
There are two types of indicators in MQL5, these are technical indicators and custom indicators.
1. Technical Indicators
These are the default indicators that come pre-loaded with MetaTrader 5. They include a wide range of technical indicators that traders can readily access, and load in their MetaTrader 5 charts to analyze the market. These indicators include popular tools such as oscillators, trend-following, and volume-based indicators.
The source code for these standard indicators is not readily available for viewing or modification since they are built into the MetaTrader 5 platform. The only way to access them from your MQL5 code is by using standard language predefined technical indicator MQL5 functions. This functionality provides us with the possibility of upgrading or customizing these standard indicators using MQL5 to create new advanced custom indicators and trading tools. I will demonstrate how you can extend the functionality of technical indicators when we develop a custom indicator that is based on smoothed multi-color candlesticks as we progress with the article.
Examples of standard MetaTrader 5 technical indicators include:
- iMA (Simple Moving Average): Calculates the simple moving average of a specified price series.
- iRSI (Relative Strength Index): Measures the magnitude of recent price changes to evaluate overbought or oversold conditions.
- iMACD (Moving Average Convergence Divergence): Identifies trend direction and potential reversals by analyzing the convergence and divergence of two moving averages.
2. Custom Indicators
As the name suggests, custom indicators are technical analysis tools you can build yourself to analyze financial markets. They differ from built-in indicators because they allow for more specific calculations and visualizations based on your trading needs.
As an MQL5 programmer, you can create indicators based on any data available to you from any source you choose. You can also import an already-created custom indicator or extend and modify the pre-built MQL5 technical indicators to build a more sophisticated and advanced custom indicator as we will.
Benefits of Custom Indicators
Here are some properties and benefits of custom indicators:
Unmatched Flexibility in Calculations:- You can design custom indicators to utilize any technical indicator formula or trading strategy you envision.
- With MQL5, you can explore a wide range of custom indicator calculations and mathematical models tailored to your specific needs.
- You can customize how the indicator results appear on the chart.
- MQL5 offers the option of using line styles, candlesticks, arrows, multi-colored objects, and many additional graphical elements to create clear and informative visualizations aligned with your trading style.
- MQL5 offers more than just creating indicators from scratch.
- You can leverage external data sources beyond typical price data to create an array of technical or fundamental analysis indicators.
- Import pre-built custom indicators created by other MQL5 programmers to improve or extend their functionality.
- Extend and modify built-in indicators to create sophisticated custom indicators tailored to your unique trading requirements.
By combining these capabilities, MQL5 empowers you to construct custom indicators that are not only tailored to your technical analysis needs but can also incorporate data and calculations beyond traditional price-based indicators.
Examples Of Free Custom Indicators In The MetaTrader 5 Terminal MetaTrader 5 terminal also provides a selection of example indicators you can access to use or study and better understand indicator development in MQL5. The source code for the free MetaTrader 5 example indicators is readily available and is a valuable resource for MQL5 programmers looking to learn and experiment with indicator creation. MQL5 example indicators are stored in the MQL5\Indicators\Examples and MQL5\Indicators\Free Indicators folders within the MetaTrader 5 installation directory.
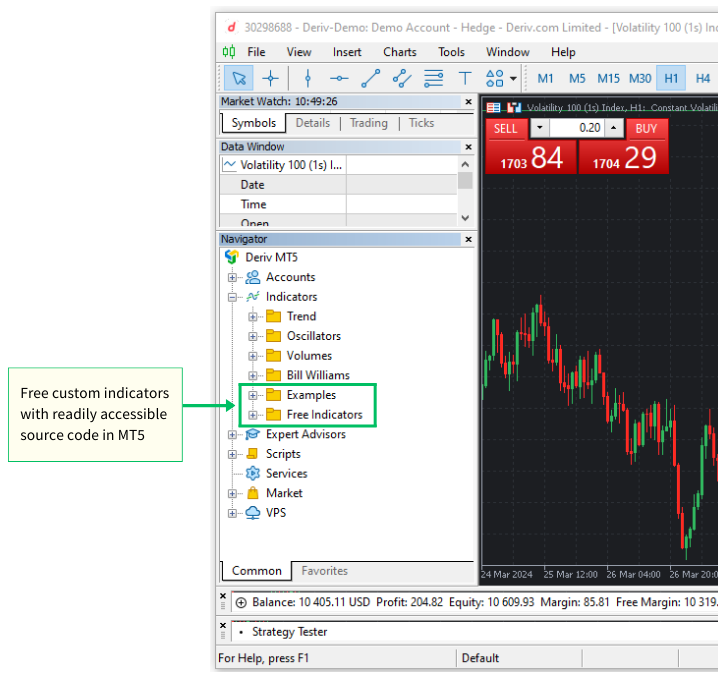
By examining and modifying example indicators, you can gain insights into MQL5 programming techniques, indicator logic, and best practices. This hands-on approach fosters learning and empowers you to develop custom indicators tailored to your own specific trading objectives.
Basic Building Blocks of Custom Indicators in MQL5
Before studying the development of custom indicators in MQL5, it's essential to understand the basic structure of an MQL5 indicator. By familiarizing yourself with the key components and functions of an indicator, you'll be better equipped to create, modify, and utilize indicators effectively in MetaTrader 5.
Custom Indicator File (.mq5)
An MQL5 indicator is typically stored in a file with the ".mq5" extension. This file contains the source code written in the MQL5 programming language, defining the logic and behavior of the indicator. All indicators are stored in the MQL5\Indicators folder within the MetaTrader 5 installation directory.
Use the Navigator panel that is found in both the MetaTrader 5 trading terminal and MetaEditor to gain access to the Indicators folder. You can also access the Indicator folder through the "MQL5" folder using the following two methods:
How To Access Indicator Files From MetaTrader 5 Trading Terminal:
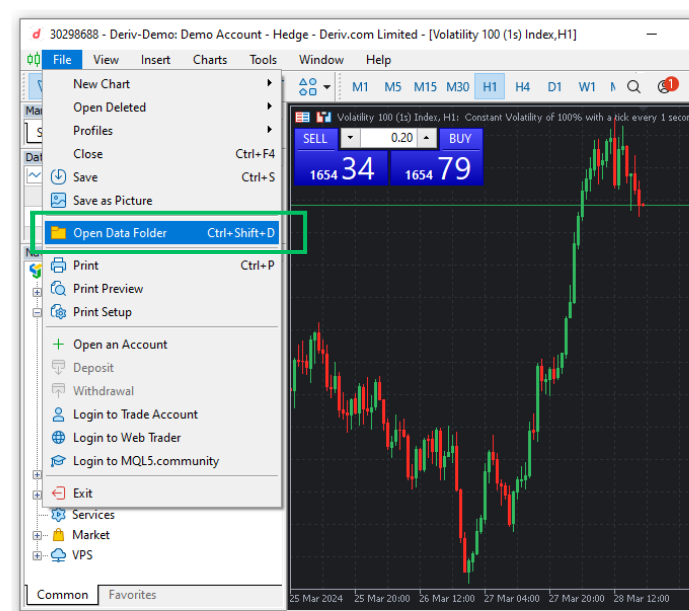
- Click on “File” in the top menu.
- Select “Open Data Folder” or use the keyboard shortcut (Ctrl + Shift + D).
- Navigate to the “MQL5/Indicators” folder.
How To Access Indicator Files From MetaEditor:
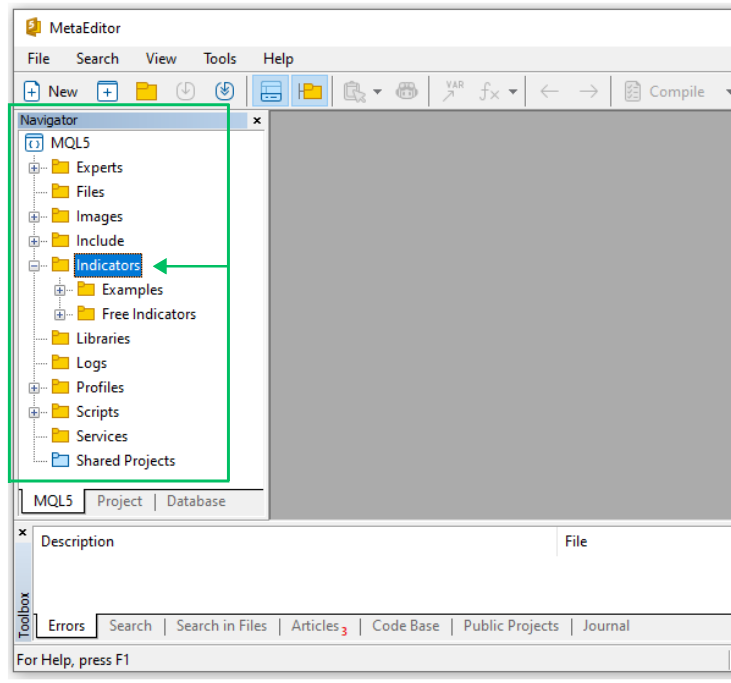
- The MetaEditor Navigator panel is located on the left side of the MetaEditor window by default and provides direct access to the MQL5 folder.
- If the Navigator panel is disabled, you can enable it by using the keyboard shortcut (Ctrl + D) or by locating and clicking the View menu option at the top of the MetaEditor 5 window. From there, select the option that says Navigator. Choosing this option will enable the navigation panel that grants you access to the MQL5 folder.
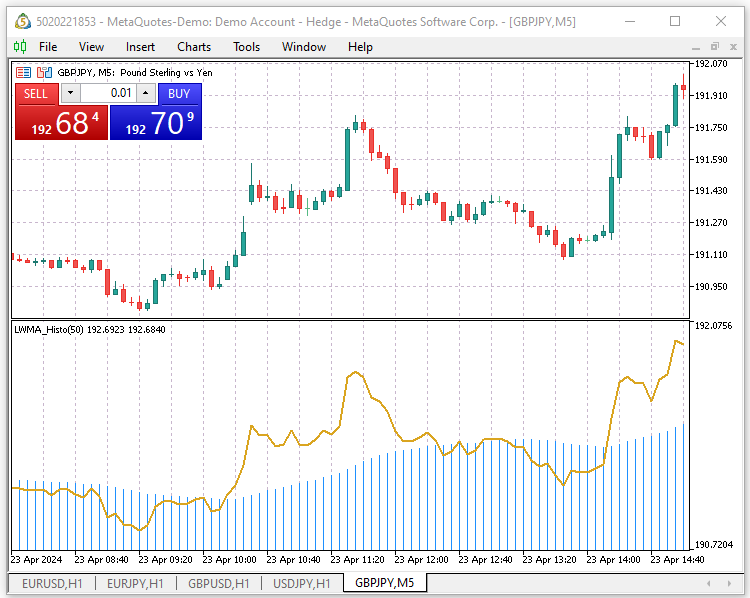
Example 1: The Linear Moving Average Histogram Custom Indicator - (LinearMovingAverageHistogram.mq5) Let us create a custom indicator so that we gain a visual understanding of the different code components needed to build a custom indicator. We will name our first custom indicator for this hands-on demonstration 'LinearMovingAverageHistogram'. It will plot a linear weighted moving average as a histogram and a line representing the current price on a separate window below the price chart.
Let us begin by creating a new custom indicator file with the MQL5 Wizard.
How To Create A New Custom Indicator File With The MQL5 Wizard
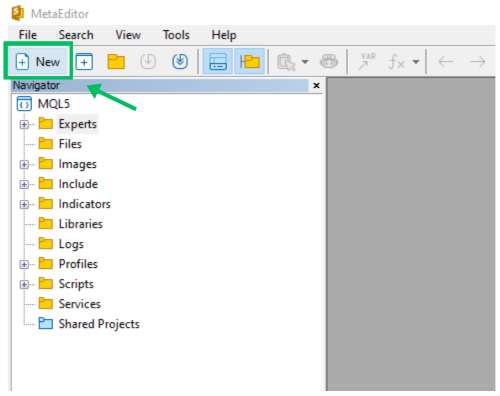
Step 1: Open the MetaEditor IDE and launch the 'MQL Wizard' using the 'New' menu item button.
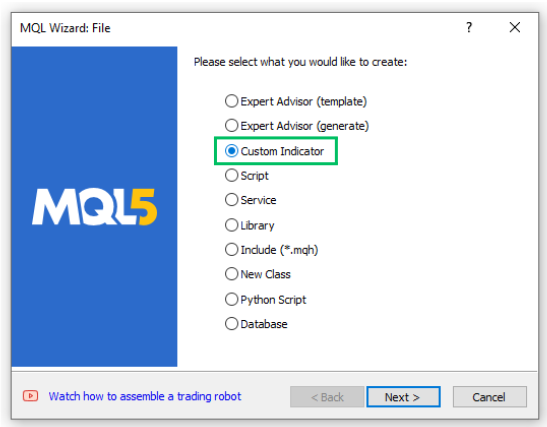
Step 2: Select the 'Custom Indicator' option and click 'Next.'
Step 3: In the 'General Properties' section, fill in the folder and name for your new custom indicator "Indicators\Article\LinearMovingAverageHistogram" and proceed by clicking 'Next.' 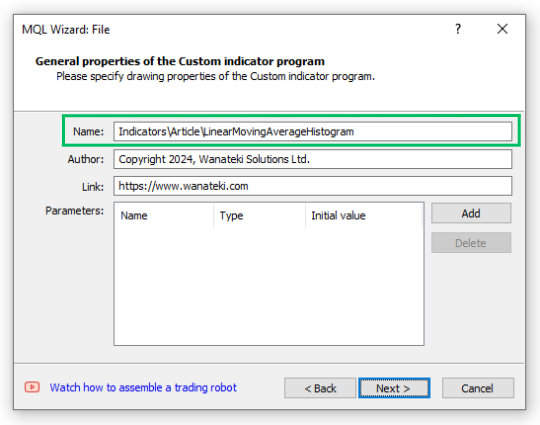
Step 4: In the 'Event handlers' section, Select the second 'OnCalculate(...,prices)' option, leave the OnTimer and OnChartEvent checkboxes unselected and click 'Next' to proceed. 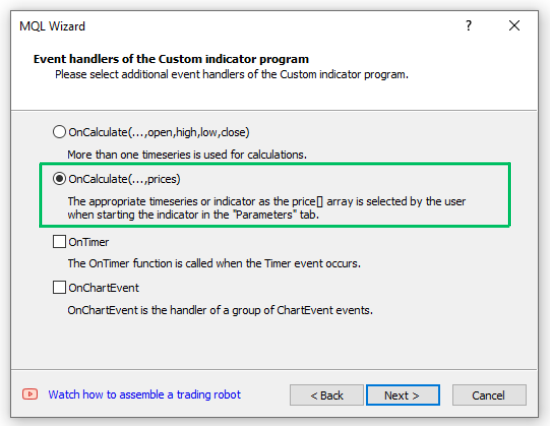
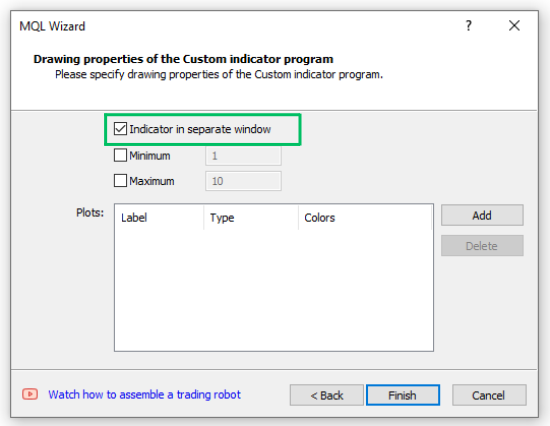
Step 5: In the 'Drawing properties' section, select or enable the 'Indicator in separate window' checkbox. Uncheck or disable the 'Minimum' and 'Maximum' checkboxes and leave the 'Plots' text input box empty. Click 'Finish' to generate the new MQL5 custom indicator file.
In the ‘MQL5/Indicators’ folder, you’ll find a new subfolder named ‘Article.’ This subfolder contains our just-created custom indicator file ‘LinearMovingAverageHistogram.mq5.’ As part of hands-on demonstrations, we’ll be coding several custom indicators throughout this article. To maintain proper organization, we will save all indicator files in this new ‘Articles’ folder.
We now have a fresh MQL5 custom indicator file with only the mandatory functions (OnInit and OnCalculate). Remember to save the new file before you proceed. Here is how our newly generated custom indicator code looks like:
//+------------------------------------------------------------------+
//|                                 LinearMovingAverageHistogram.mq5 |
//|                          Copyright 2024, Wanateki Solutions Ltd. |
//|                                         https://www.wanateki.com |
//+------------------------------------------------------------------+
#property copyright "Copyright 2024, Wanateki Solutions Ltd."
#property link      "https://www.wanateki.com"
#property version   "1.00"
#property indicator_separate_window
//+------------------------------------------------------------------+
//| Custom indicator initialization function                         |
//+------------------------------------------------------------------+
int OnInit()
  {
//--- indicator buffers mapping

//---
   return(INIT_SUCCEEDED);
  }
//+------------------------------------------------------------------+
//| Custom indicator iteration function                              |
//+------------------------------------------------------------------+
int OnCalculate(const int rates_total,
                const int prev_calculated,
                const int begin,
                const double &price[])
  {
//---

//--- return value of prev_calculated for next call
   return(rates_total);
  }
//+------------------------------------------------------------------+
Basic Components Of A Custom Indicator File (.mq5) The indicator file consists of various sections. Let us analyze how the different parts of the indicator code work: Header Section The indicator header section is made up of three parts, the header comments, property directives, external include files, and global variable definitions. Below is a breakdown of what is included in our indicators header section: 1. Header Comments: This is the first section of our indicator code. It contains commented-out information about the indicator, such as its file name, copyright information, and a link to the author's website. These comments do not impact the functionality of the indicator code in any way.
//+------------------------------------------------------------------+
//|                                 LinearMovingAverageHistogram.mq5 |
//|                          Copyright 2024, Wanateki Solutions Ltd. |
//|                                         https://www.wanateki.com |
//+------------------------------------------------------------------+
2. Property Directives: The property directives provide additional information about the indicator. They include the copyright, a link associated with the indicator or author, the current version of the indicator, and specific instructions on how to display the indicator. The most important property directive is the "#property indicator_separate_window" which instructs the platform to display the indicator in a separate window.
#property copyright "Copyright 2024, Wanateki Solutions Ltd."
#property link      "https://www.wanateki.com"
#property version   "1.00"
#property indicator_separate_window
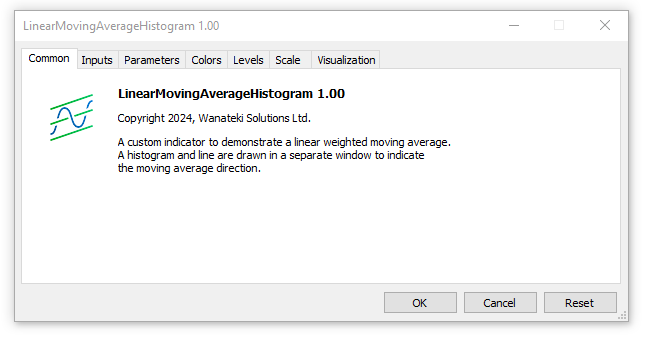
The copyright, link, author, and description property directives are visible on the "Common" tab of the small indicator setup sub-window (panel) that appears when you are loading the indicator on the chart.
3. Global Variables: All the global variables are placed below the property directives. Our indicator code currently contains no global variables since we didn't specify them when generating the file with the MQL5 Wizard. We'll define all our global and user input variables below the #property directives as we proceed through this article.
MQL5 Standard Custom Indicator Functions Below the header section you will find different functions. All indicators must contain the OnInit and OnCalculate standard MQL5 functions. User-created functions are optional but encouraged for proper code organization. Here is a breakdown of the different functions in our indicator code: 1. Indicator Initialization Function (OnInit()): The OnInit() function is called when the indicator is initialized. It typically performs setup tasks, such as mapping indicator buffers and initializing any global variables. I will introduce you to indicator buffers as we dig deeper into the article. When the function is executed successfully, it returns INIT_SUCCEEDED and when initialization fails, it returns INIT_FAILED.
//+------------------------------------------------------------------+
//| Custom indicator initialization function                         |
//+------------------------------------------------------------------+
int OnInit()
  {
//--- indicator buffers mapping

//---
   return(INIT_SUCCEEDED);
  }
2. Indicator Iteration Function (OnCalculate()): The OnCalculate() function in MQL5 is the main nerve center of all custom indicator calculations. It's called whenever there's a change in price data, prompting the indicator to update its values. There are two main versions of OnCalculate() which I will explain further down the article.
//+------------------------------------------------------------------+
//| Custom indicator iteration function                              |
//+------------------------------------------------------------------+
int OnCalculate(const int rates_total,
                const int prev_calculated,
                const int begin,
                const double &price[])
  {
//---

//--- return value of prev_calculated for next call
   return(rates_total);
  }
3. Indicator De-Initialization Function (OnDeinit()): The OnDeinit() function has not been added to our code but it is a very important function. It is called when the indicator is terminating and is responsible for executing the deinitialization procedures. It typically performs all the clean-up tasks, such as releasing any technical indicator handles.
//+------------------------------------------------------------------+
//| Indicator deinitialization function                              |
//+------------------------------------------------------------------+
void OnDeinit(const int reason)
  {
   //-- deinitialization code
  }
//+------------------------------------------------------------------+
When we compile our indicator code, we encounter 1 warning: "no indicator plot defined for indicator".

This warning signifies that our custom indicator lacks a crucial definition of how its data should be displayed on the chart. As expected, our current indicator code serves as a mere skeleton without any functional components. To correct this, let’s dig deeper and write the essential code segments that will breathe life into our indicator.
Description Property Directives Let us begin by writing a short description of the custom indicator in the indicator header section:
#property description "A custom indicator to demonstrate a linear weighted moving average."
#property description "A histogram and line are drawn in a separate window to indicate "
#property description "the moving average direction."
Buffers and Plots Property Directives All custom indicators have different properties that are always positioned at the beginning of the file as I had earlier elaborated. Some are optional but the following three are always mandatory:
- indicator_separate_window or indicator_chart_window: Used to specify if an indicator will be plotted on a separate window or directly on the chart window.
- indicator_buffers: Specifies the number of indicator buffers used by the custom indicator.
- indicator_plots: Specifies the number of plots used by the custom indicator.
We need two indicator buffers and two plots for storing and plotting our new custom indicator data. One indicator buffer for the histogram and another one for the line that will display the current price of the symbol. Followed by one plot for the histogram and another plot for the price line.
//--- indicator buffers and plots
#property indicator_buffers 2
#property indicator_plots   2
Label, Type, and Style Property Directives
Next, we should specify the other details like the indicator label, type, color, style, and width of both the histogram and price line.
//--- plots1 details for the ma histogram
#property indicator_label1  "MA_Histogram"
#property indicator_type1   DRAW_HISTOGRAM
#property indicator_color1  clrDodgerBlue
#property indicator_style1  STYLE_SOLID
#property indicator_width1  1

//--- plots2 details for the price line
#property indicator_label2  "Current_Price_Line"
#property indicator_type2   DRAW_LINE
#property indicator_color2  clrGoldenrod
#property indicator_style2  STYLE_SOLID
#property indicator_width2  2
Global User Input Variables
Next, we specify the custom indicator's user input variables (moving average period and shift) that will be used to store different indicator parameters.
//--- input parameters for the moving averages
input int            _maPeriod = 50;       // MA Period
input int            _maShift = 0;         // MA Shift
Declaration Of Indicator Buffer Dynamic Arrays In The Global Scope
Next, we declare the indicator buffer for the moving average histogram and price line. Indicator buffers are among the basic pillars of custom indicators and are responsible for storing the indicator's data in dynamic arrays. You should begin by declaring a dynamic array and then registering it as an indicator buffer using a special MQL5 function 'SetIndexBuffer' to convert it into a special terminal-managed array. After doing this, the terminal will be responsible for allocating memory for the array and providing public access to it as a new timeseries accessible array, on which other indicators can be calculated.
We will first declare the histogram and line indicator buffers as dynamic arrays and then later on in the OnInit() function we will use the 'SetIndexBuffer' special MQL5 function to register and convert them into terminal-managed timeseries accessible arrays.
//--- indicator buffer
double maHistogramBuffer[], priceLineBuffer[];
Custom Indicator Initialization Function - GetInit()
Next, we are going to create a custom function that will be responsible for initializing our custom indicator. Begin by creating a blank function that is of type void meaning that it returns no data. Name the function 'GetInit()'. Place the 'SetIndexBuffer(...)' special function that will be responsible for converting our indicator buffers dynamic arrays that we had declared earlier 'maHistogramBuffer' and 'priceLineBuffer' into terminal-managed timeseries arrays.
//+------------------------------------------------------------------+
//| User custom function for custom indicator initialization         |
//+------------------------------------------------------------------+
void GetInit()
  {
//--- set the indicator buffer mapping
   SetIndexBuffer(0, maHistogramBuffer, INDICATOR_DATA);
   SetIndexBuffer(1, priceLineBuffer, INDICATOR_DATA);

  }
//+------------------------------------------------------------------+
Next, we set the indicator accuracy to match the symbol's digit value.
//--- set the indicators accuracy
   IndicatorSetInteger(INDICATOR_DIGITS, _Digits + 1);
Next, we define the first bar from where the index will start being drawn.
//--- set the first bar from where the index will be drawn
   PlotIndexSetInteger(0, PLOT_DRAW_BEGIN, _maPeriod);
   PlotIndexSetInteger(1, PLOT_DRAW_BEGIN, 0);
Set up the moving average indicator shift to the user-specified value for the moving average handle and use a zero value for the price line. This will be used when plotting or drawing the indicator.
//--- set the indicator shifts when drawing
   PlotIndexSetInteger(0, PLOT_SHIFT, _maShift);
   PlotIndexSetInteger(1, PLOT_SHIFT, 0);
Next, we set the name that will be shown in the MT5 Data Window for the indicator values from the indicator data buffer. We use a switch control to set the indicator's short name for the data window.
//--- set the name to be displayed in the MT5 DataWindow
   IndicatorSetString(INDICATOR_SHORTNAME, "LWMA_Histo" + "(" + string(_maPeriod) + ")");
To finalize the indicator initialization function, we will set the drawing histogram to an empty value.
//--- set the drawing histogram and line to an empty value
   PlotIndexSetDouble(0, PLOT_EMPTY_VALUE, 0.0);
   PlotIndexSetDouble(1, PLOT_EMPTY_VALUE, 0.0);
Custom Function To Calculate The Linear Weighted Moving Average - GetLWMA()
Next, we need to create a custom function called 'GetLWMA(..)' that will be responsible for calculating the linear weighted moving average. The function will be of type void as we do not want it to return any data. It will accept four arguments as function parameters (rates_total, prev_calculated, begin, &price).
//+------------------------------------------------------------------+
//|  Function to calculate the linear weighted moving average        |
//+------------------------------------------------------------------+
void GetLWMA(int rates_total, int prev_calculated, int begin, const double &price[])
  {
   int    weight = 0;
   int    x, l, start;
   double sum = 0.0, lsum = 0.0;
//--- first calculation or number of bars was changed
   if(prev_calculated <= _maPeriod + begin + 2)
     {
      start = _maPeriod + begin;
      //--- set empty value for first start bars
      for(x=0; x < start; x++)
        {
         maHistogramBuffer[x] = 0.0;
         priceLineBuffer[x] = price[x];
        }
     }
   else
      start = prev_calculated - 1;

   for(x = start - _maPeriod, l = 1; x < start; x++, l++)
     {
      sum   += price[x] * l;
      lsum  += price[x];
      weight += l;
     }
   maHistogramBuffer[start-1] = sum/weight;
   priceLineBuffer[x] = price[x];
//--- main loop
   for(x=start; x<rates_total && !IsStopped(); x++)
     {
      sum             = sum - lsum + price[x] * _maPeriod;
      lsum            = lsum - price[x - _maPeriod] + price[x];
      maHistogramBuffer[x] = sum / weight;
      priceLineBuffer[x] = price[x];
     }
  }
Indicator Main Iteration Function - OnCalculate()
The custom indicator iteration function 'OnCalculate(..)' is the heart of our custom indicator and it is responsible for updating and plotting our indicator when there is a new tick or price change and all the required calculations originate here. We are currently using the short form of the OnCalculate() function:
int OnCalculate(const int rates_total,
                const int prev_calculated,
                const int begin,
                const double &price[])
  {
   return(rates_total);
  }
This function takes four input parameters or arguments:
- rates_total: This parameter holds the value of the total number of elements of the price[] array. It is passed as an input parameter for calculating indicator values as we earlier did with the 'GetLWMA(..)' function.
- prev_calculated: This parameter stores the result of the execution of 'OnCalculate(..)' at the previous call. It plays a key role in the algorithm for calculating indicator values and makes sure that we do not do calculations for the entire history period on each 'OnCalculate(..)' function call or when a new price change happens.
- begin: This parameter stores the number of the starting value of the price array, which doesn't contain data for calculation. In our custom indicator, this value is the "_maPeriod" and it simply tells the 'OnCalculte(...)' function to halt all calculations until all the bars reach the "_maPeriod" stored value so that it has enough bars for the indicator calculations.
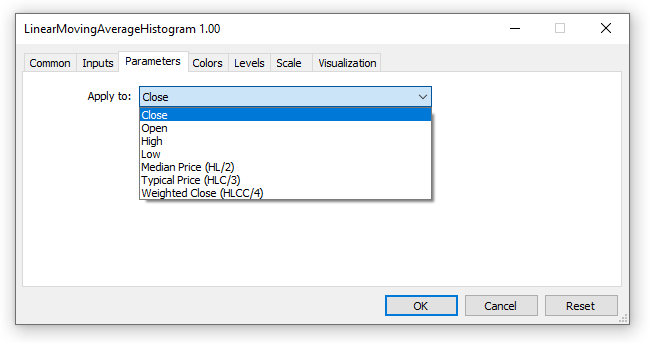
- price: This parameter stores the applied price used for calculating the indicator data. It is specified by the user when loading the custom indicator on the chart. Users have the option of either selecting open, close, high, low, median price (HL / 2), typical price (HLC / 3), weighted close (HLCC / 4), or values of the previously loaded indicators data.
Here is the code to our 'OnCalculate(...)' function:
//+------------------------------------------------------------------+
//| Custom indicator iteration function                              |
//+------------------------------------------------------------------+
int OnCalculate(const int rates_total,
                const int prev_calculated,
                const int begin,
                const double &price[])
  {
//--- check if we have enough bars to do the calculations
   if(rates_total < _maPeriod - 1 + begin)
      return(0);

//--- first calculation or number of bars was changed
   if(prev_calculated == 0)
     {
      ArrayInitialize(maHistogramBuffer, 0);
      PlotIndexSetInteger(0, PLOT_DRAW_BEGIN, _maPeriod - 1 + begin);
     }
//--- calculate the linear weighted moving average and plot it on the chart
   GetLWMA(rates_total, prev_calculated, begin, price);

//--- return value of prev_calculated for next call
   return(rates_total);
  }
//+------------------------------------------------------------------+
We now have all the different code segments of our newly created custom indicator. Make sure that your 'LinearMovingAverageHistogram' file looks like and has all the components of the code below:
#property version   "1.00"
#property indicator_separate_window

//--- indicator buffers and plots
#property indicator_buffers 2
#property indicator_plots   2

//--- plots1 details for the ma histogram
#property indicator_label1  "MA_Histogram"
#property indicator_type1   DRAW_HISTOGRAM
#property indicator_color1  clrDodgerBlue
#property indicator_style1  STYLE_SOLID
#property indicator_width1  1

//--- plots2 details for the price line
#property indicator_label2  "Current_Price_Line"
#property indicator_type2   DRAW_LINE
#property indicator_color2  clrGoldenrod
#property indicator_style2  STYLE_SOLID
#property indicator_width2  2

//--- input parameters for the moving averages
input int            _maPeriod = 50;       // MA Period
input int            _maShift = 0;         // MA Shift

//--- indicator buffer
double maHistogramBuffer[], priceLineBuffer[];

//+------------------------------------------------------------------+
//| Custom indicator initialization function                         |
//+------------------------------------------------------------------+
int OnInit()
  {
//--- call the custom initialization function
   GetInit();

//---
   return(INIT_SUCCEEDED);
  }
//+------------------------------------------------------------------+
//| Custom indicator iteration function                              |
//+------------------------------------------------------------------+
int OnCalculate(const int rates_total,
                const int prev_calculated,
                const int begin,
                const double &price[])
  {
//--- check if we have enough bars to do the calculations
   if(rates_total < _maPeriod - 1 + begin)
      return(0);

//--- first calculation or number of bars was changed
   if(prev_calculated == 0)
     {
      ArrayInitialize(maHistogramBuffer, 0);
      PlotIndexSetInteger(0, PLOT_DRAW_BEGIN, _maPeriod - 1 + begin);
     }
//--- calculate the linear weighted moving average and plot it on the chart
   GetLWMA(rates_total, prev_calculated, begin, price);

//--- return value of prev_calculated for next call
   return(rates_total);
  }
//+------------------------------------------------------------------+

//+------------------------------------------------------------------+
//| User custom function for custom indicator initialization         |
//+------------------------------------------------------------------+
void GetInit()
  {
//--- set the indicator buffer mapping
   SetIndexBuffer(0, maHistogramBuffer, INDICATOR_DATA);
   SetIndexBuffer(1, priceLineBuffer, INDICATOR_DATA);

//--- set the indicators accuracy
   IndicatorSetInteger(INDICATOR_DIGITS, _Digits + 1);

//--- set the first bar from where the index will be drawn
   PlotIndexSetInteger(0, PLOT_DRAW_BEGIN, _maPeriod);
   PlotIndexSetInteger(1, PLOT_DRAW_BEGIN, 0);

//--- set the indicator shifts when drawing
   PlotIndexSetInteger(0, PLOT_SHIFT, _maShift);
   PlotIndexSetInteger(1, PLOT_SHIFT, 0);

//--- set the name to be displayed in the MT5 DataWindow
   IndicatorSetString(INDICATOR_SHORTNAME, "LWMA_Histo" + "(" + string(_maPeriod) + ")");

//--- set the drawing histogram and line to an empty value
   PlotIndexSetDouble(0, PLOT_EMPTY_VALUE, 0.0);
   PlotIndexSetDouble(1, PLOT_EMPTY_VALUE, 0.0);
  }
//+------------------------------------------------------------------+

//+------------------------------------------------------------------+
//|  Function to calculate the linear weighted moving average        |
//+------------------------------------------------------------------+
void GetLWMA(int rates_total, int prev_calculated, int begin, const double &price[])
  {
   int    weight = 0;
   int    x, l, start;
   double sum = 0.0, lsum = 0.0;
//--- first calculation or number of bars was changed
   if(prev_calculated <= _maPeriod + begin + 2)
     {
      start = _maPeriod + begin;
      //--- set empty value for first start bars
      for(x=0; x < start; x++)
        {
         maHistogramBuffer[x] = 0.0;
         priceLineBuffer[x] = price[x];
        }
     }
   else
      start = prev_calculated - 1;

   for(x = start - _maPeriod, l = 1; x < start; x++, l++)
     {
      sum   += price[x] * l;
      lsum  += price[x];
      weight += l;
     }
   maHistogramBuffer[start-1] = sum/weight;
   priceLineBuffer[x] = price[x];
//--- main loop
   for(x=start; x<rates_total && !IsStopped(); x++)
     {
      sum             = sum - lsum + price[x] * _maPeriod;
      lsum            = lsum - price[x - _maPeriod] + price[x];
      maHistogramBuffer[x] = sum / weight;
      priceLineBuffer[x] = price[x];
     }
  }
When you save and compile the custom indicator, you will notice that now it doesn't contain any warnings or errors. Open your MetaTrader 5 trading terminal to load and test it in your charts.
More Hands-On Practical Examples
Now that you are familiar with the basic building blocks of custom indicators, we should create a few simple custom indicators to help us solidify this knowledge. We will follow all the steps we defined earlier and implement all the basic foundations of custom indicators in the examples below.
Example 2: The Spread Monitor Custom Indicator - (SpreadMonitor.mq5)
Let us continue with our hands on approach and create another simple custom indicator that uses spread data to display a multi-colored histogram in a separate widow. This indicator will be useful for symbols that use a floating spread and will make it easier for you to monitor how the spread fluctuates or spikes over time in a visual and easy-to-analyze manner. Use the MQL Wizard as we did earlier on to create a new custom indicator file with the name 'SpreadMonitor.mq5'. Remember to save it in the 'Article' folder to maintain a neat and organized file structure.
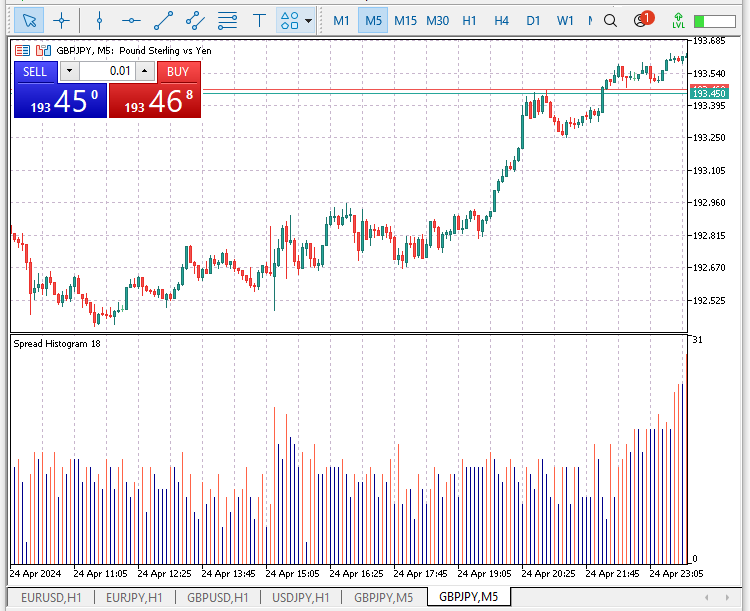
In this example, I will demonstrate how to create a multi-colored indicator. When the current spread is higher than the previous spread, the histogram will change to a red color to signify an increase in the spread, and when the current spread is lower than the previous spread the histogram will change to a blue color to signify that the spread is decreasing. This custom indicator feature will be best observed on symbols with a floating spread and a quick glance of the indicator when its loaded on a chart makes it easy to spot periods where the spread is rapidly spiking.
After you have generated the new 'SpreadMonitor.mq5' custom indicator file with the MQL Wizard, add the following code.
Start by specifying where the indicator will be displayed:
//--- indicator window settings
#property indicator_separate_window
Specify the number of indicator buffers and plots:
//--- indicator buffers and plots
#property indicator_buffers 2
#property indicator_plots   1
Set the indicator type, and style and specify the different colors:
//--- indicator type and style settings
#property indicator_type1   DRAW_COLOR_HISTOGRAM
#property indicator_color1  clrDarkBlue, clrTomato
#property indicator_style1  0
#property indicator_width1  1
#property indicator_minimum 0.0
Declare the dynamic arrays that will be used as indicator buffers in the global scope:
//--- indicator buffers
double spreadDataBuffer[];
double histoColorsBuffer[];
Create the custom function that will be responsible for initializing our indicator:
//+------------------------------------------------------------------+
//| User custom function for custom indicator initialization         |
//+------------------------------------------------------------------+
void GetInit(){
}
//+------------------------------------------------------------------+
Inside our new indicator initialization function 'GetInit()'. Register and map the indicator buffers:
//--- set and register the indicator buffers mapping
   SetIndexBuffer(0, spreadDataBuffer, INDICATOR_DATA);
   SetIndexBuffer(1, histoColorsBuffer, INDICATOR_COLOR_INDEX);
Set the name that will appear in MetaTrader 5's DataWindow and as the indicator subwindow label:
//--- name for mt5 datawindow and the indicator subwindow label
   IndicatorSetString(INDICATOR_SHORTNAME,"Spread Histogram");
Set the indicator's digits for accuracy and precision:
//--- set the indicators accuracy digits
   IndicatorSetInteger(INDICATOR_DIGITS, 0);
The next step will be to create a custom function to calculate the spread. Let us name the function 'GetSpreadData()' and specify that it should hold three parameters or arguments. The function will be of type void since we do not require it to return any data:
//+------------------------------------------------------------------+
//| Custom function for calculating the spread                       |
//+------------------------------------------------------------------+
void GetSpreadData(const int position, const int rates_total, const int& spreadData[])
  {
   spreadDataBuffer[0] = (double)spreadData[0];
   histoColorsBuffer[0] = 0.0;
//---
   for(int x = position; x < rates_total && !IsStopped(); x++)
     {
      double currentSpread = (double)spreadData[x];
      double previousSpread = (double)spreadData[x - 1];

      //--- calculate and save the spread
      spreadDataBuffer[x] = currentSpread;
      if(currentSpread > previousSpread)
        {
         histoColorsBuffer[x] = 1.0; //-- set the histogram to clrTomato
        }
      else
        {
         histoColorsBuffer[x] = 0.0; //-- set the histogram to clrDarkBlue
        }
     }
//---
  }
//+------------------------------------------------------------------+
The custom indicator can not function with an empty OnCalculate() function. In this example, we will be using the long version of OnCalculate() that specifically uses ten parameters for storing and processing the custom indicator's data.
//+------------------------------------------------------------------+
//| Custom indicator iteration function                              |
//+------------------------------------------------------------------+
int OnCalculate(const int rates_total,
                const int prev_calculated,
                const datetime &time[],
                const double &open[],
                const double &high[],
                const double &low[],
                const double &close[],
                const long &tick_volume[],
                const long &volume[],
                const int &spread[])
  {
//--- check if we have enough data start calculating
   if(rates_total < 2) //--- don't do any calculations, exit and reload function
      return(0);

//--- we have new data, starting the calculations
   int position = prev_calculated - 1;

//--- update the position variable
   if(position < 1)
     {
      spreadDataBuffer[0] = 0;
      position = 1;
     }
//--- calculate and get the tick volume
   GetSpreadData(position, rates_total, spread);

//--- Exit function and return new prev_calculated value
   return(rates_total);
  }
The SpreadMonitor custom indicator is almost complete, let us join all the different code segments together and save the file before we compile and load it in a MetaTrader 5 chart.
//--- indicator window settings
#property indicator_separate_window

//--- indicator buffers and plots
#property indicator_buffers 2
#property indicator_plots   1

//--- indicator type and style settings
#property indicator_type1   DRAW_COLOR_HISTOGRAM
#property indicator_color1  clrDarkBlue, clrTomato
#property indicator_style1  0
#property indicator_width1  1
#property indicator_minimum 0.0

//--- indicator buffers
double spreadDataBuffer[];
double histoColorsBuffer[];

//+------------------------------------------------------------------+
//| Custom indicator initialization function                         |
//+------------------------------------------------------------------+
int OnInit()
  {
//--- initialize the indicator
   GetInit();

   return(INIT_SUCCEEDED);
  }

//+------------------------------------------------------------------+
//| Custom indicator iteration function                              |
//+------------------------------------------------------------------+
int OnCalculate(const int rates_total,
                const int prev_calculated,
                const datetime &time[],
                const double &open[],
                const double &high[],
                const double &low[],
                const double &close[],
                const long &tick_volume[],
                const long &volume[],
                const int &spread[])
  {
//--- check if we have enough data start calculating
   if(rates_total < 2) //--- don't do any calculations, exit and reload function
      return(0);

//--- we have new data, starting the calculations
   int position = prev_calculated - 1;

//--- update the position variable
   if(position < 1)
     {
      spreadDataBuffer[0] = 0;
      position = 1;
     }
//--- calculate and get the tick volume
   GetSpreadData(position, rates_total, spread);

//--- Exit function and return new prev_calculated value
   return(rates_total);
  }

//+------------------------------------------------------------------+
//| Custom function for calculating the spread                       |
//+------------------------------------------------------------------+
void GetSpreadData(const int position, const int rates_total, const int& spreadData[])
  {
   spreadDataBuffer[0] = (double)spreadData[0];
   histoColorsBuffer[0] = 0.0;
//---
   for(int x = position; x < rates_total && !IsStopped(); x++)
     {
      double currentSpread = (double)spreadData[x];
      double previousSpread = (double)spreadData[x - 1];

      //--- calculate and save the spread
      spreadDataBuffer[x] = currentSpread;
      if(currentSpread > previousSpread)
        {
         histoColorsBuffer[x] = 1.0; //-- set the histogram to clrTomato
        }
      else
        {
         histoColorsBuffer[x] = 0.0; //-- set the histogram to clrDarkBlue
        }
     }
//---
  }
//+------------------------------------------------------------------+

//+------------------------------------------------------------------+
//| User custom function for custom indicator initialization         |
//+------------------------------------------------------------------+
void GetInit()
  {
//--- set and register the indicator buffers mapping
   SetIndexBuffer(0, spreadDataBuffer, INDICATOR_DATA);
   SetIndexBuffer(1, histoColorsBuffer, INDICATOR_COLOR_INDEX);

//--- name for mt5 datawindow and the indicator subwindow label
   IndicatorSetString(INDICATOR_SHORTNAME,"Spread Histogram");

//--- set the indicators accuracy digits
   IndicatorSetInteger(INDICATOR_DIGITS, 0);
  }
//+------------------------------------------------------------------+
Here is the SpreadMonitor custom indicator loaded in a MetaTrader 5 GBPJPY five minute chart.
Example 3: Smoothed Multi-Color Candlestick Custom Indicator - (SmoothedCandlesticks.mq5)
Since indicators are mainly visual representations of trading strategies, multi-colored indicators are preferable to indicators that only display visual data in a single color. Multi-colored indicators make it easy for traders to identify trading signals generated by the indicator quickly and this helps in streamlining the indicator's efficiency and ease of use.
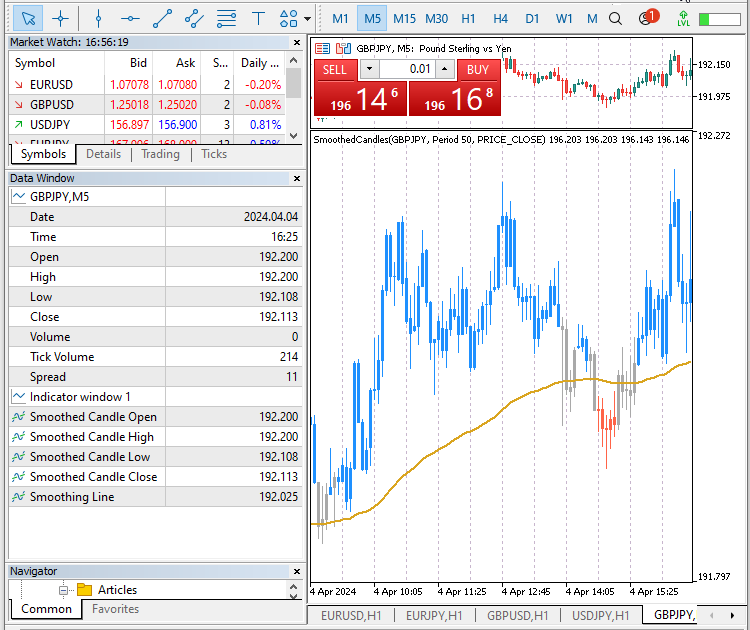
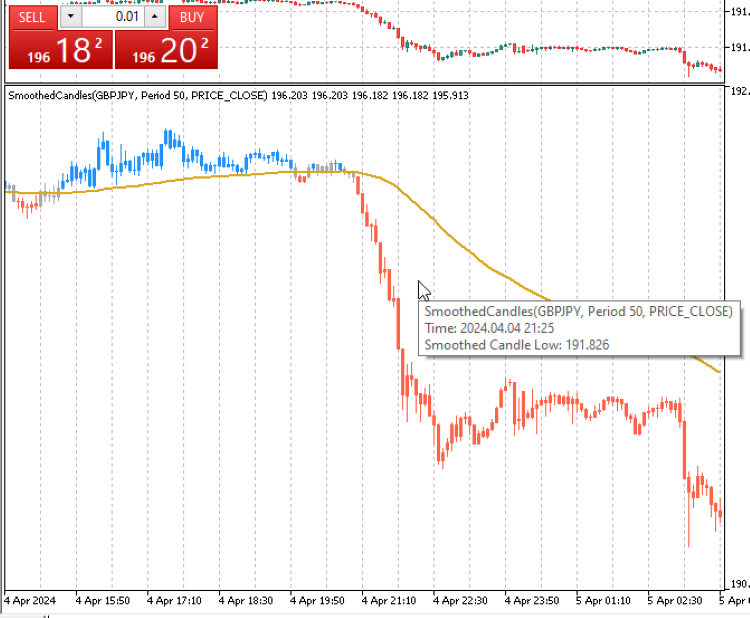
Having the ability to create multi-colored indicators is a very useful skill for any MQL5 developer and in this example, I will demonstrate how you can create a smoothed multi-colored candlestick custom indicator. Eliminating market noise has always been a priority for traders and this simple indicator accomplishes this by taking the calculations of the smoothed moving averages to create multi-colored candlesticks that change color according to the moving averages signal. This creates a neat chart that is easy to interpret and eliminates the need to use the crosshairs charting tool to detect if a moving average crossover has happened.
The candles turn green when the open, high, low, and close prices are higher than the smoothed moving average and turn red when the open, high, low, and close prices are lower than the smoothed moving average. If the smoothed moving average touches any part of the candle's body, meaning that it is between the high and low candle prices, the candle will turn dark grey to show that there is no entry signal being generated by the smoothed indicator.
This example will also demonstrate how to use the MQL5 standard indicators through the predefined technical indicator MQL5 functions we had earlier discussed. Use the MQL5 Wizard to create a new custom indicator file and name it 'SmoothedCandlesticks.mq5'. Remember to save it in the 'Article' folder together with the other custom indicator files we have previously created.
Specify The Indicator #Property Directives
Begin by specifying where the indicator will be displayed, either in the chart window or a separate window below the price chart. The indicator will work in all scenarios and you can alternate through displaying it in a separate window and in the chart window to test how it visually appears.
//--- specify where to display the indicator
#property indicator_separate_window
//#property indicator_chart_window
Specify the indicator buffers. In this indicator, we are going to use six indicator buffers to plot and display our data. We will have four indicator buffers for the candle open, close, high, and low prices. One indicator buffer for the smoothed moving average line and another indicator buffer to store the colors for our candles. This adds up to a total of six indicator buffers.
//--- indicator buffers
#property indicator_buffers 6
We need two indicator plots for the drawing of our indicator. One plot to draw the candlesticks and another plot for the smoothed moving average line. This adds up to a total of two indicator plots.
//--- indicator plots
#property indicator_plots   2
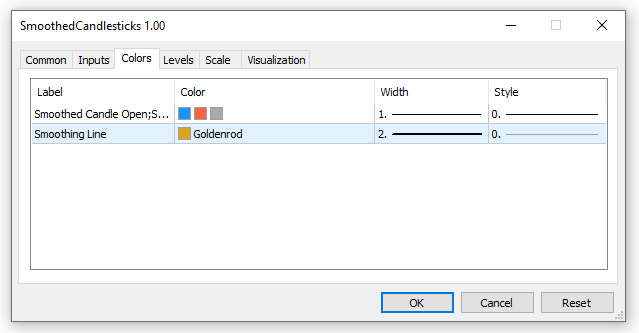
Specify the plot details for the smoothed candles. This includes values for the type, color, and label. The label is displayed on the data window together with the corresponding data like the price. Our indicator uses multi-colored candles and we need to provide a total of three colors that will change depending on the current trade signal as I had earlier explained. The user will have the option of changing the specified colors before loading the indicator on the chart in the indicator panel.
//--- plots1 details for the smoothed candles
#property indicator_type1   DRAW_COLOR_CANDLES
#property indicator_color1  clrDodgerBlue, clrTomato, clrDarkGray
#property indicator_label1  "Smoothed Candle Open;Smoothed Candle High;Smoothed Candle Low;Smoothed Candle Close;"
Repeat the above step and specify the second plot details for the smoothed moving average line. We will only specify one color for the smoothed line since it's not a multi-color line.
//--- plots2 details for the smoothing line
#property indicator_label2  "Smoothing Line"
#property indicator_type2   DRAW_LINE
#property indicator_color2  clrGoldenrod
#property indicator_style2  STYLE_SOLID
#property indicator_width2  2
User Input Variables In The Global Scope
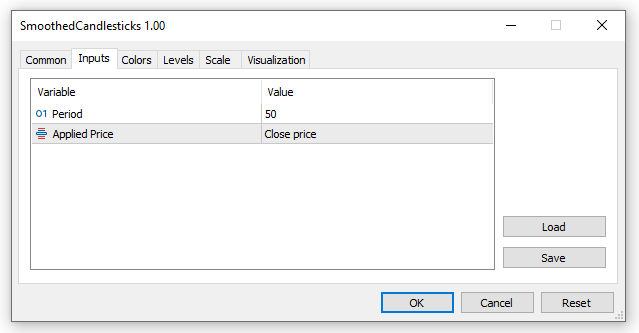
Declare the user input variables to capture and save the smoothed moving average period and the applied price for calculations.
//--- user input parameters for the moving averages
input int                _maPeriod = 50;                    // Period
input ENUM_APPLIED_PRICE _maAppliedPrice = PRICE_CLOSE;     // Applied Price
Indicator Variables, Buffers and Technical Indicator Handle In The Global Scope
Here we are going to declare dynamic arrays to store our indicator buffers. We had earlier used to #property directive to allocate six indicator buffers. Let us first begin by declaring five indicator buffers for the open, close, high, low, and candlestick storage. The remaining buffer for the smoothed line will be declared below since we will use MQL5 standard technical indicator iMA function to manage this buffer.
//--- indicator buffers
double openBuffer[];
double highBuffer[];
double lowBuffer[];
double closeBuffer[];
double candleColorBuffer[];
Next, we declare the buffer for the smoothed line and a handle to gain access to the iMA technical indicator function. Using the already created MQL5 standard technical indicator function saves us time and is more efficient since all the smoothing calculations for the candles will efficiently be performed will less code.
//Moving average dynamic array (buffer) and variables
double iMA_Buffer[];
int maHandle; //stores the handle of the iMA indicator
Here we declare and initialize our last global variable 'barsCalculated' with a value of zero. This integer variable is used to store the number of bars calculated from the iMA smoothed moving average. We will use it in the OnCalculate() function.
//--- integer to store the number of values in the moving average indicator
int barsCalculated = 0;
Custom Function For The Indicator Initialization - GetInit()
Now that we are done with the header section of our custom indicator, we are going to create a custom function to perform all the initialization tasks. Let us name the function 'GetInit()' and specify that it should return a boolean value to indicate if the indicator initialization was successful. If the initialization fails then the indicator should terminate and close.
In the initialization function, we will perform some important tasks like; setting up and registering the indicator buffers, saving the short name for the indicator, and creating the iMA handle for the smoothing line, among other basic initialization tasks.
//+------------------------------------------------------------------+
//| User custom function for custom indicator initialization         |
//+------------------------------------------------------------------+
bool GetInit()
  {
//--- set the indicator buffer mapping by assigning the indicator buffer array
   SetIndexBuffer(0, openBuffer, INDICATOR_DATA);
   SetIndexBuffer(1, highBuffer, INDICATOR_DATA);
   SetIndexBuffer(2, lowBuffer, INDICATOR_DATA);
   SetIndexBuffer(3, closeBuffer, INDICATOR_DATA);
   SetIndexBuffer(4, candleColorBuffer, INDICATOR_COLOR_INDEX);

//--- buffer for iMA
   SetIndexBuffer(5, iMA_Buffer, INDICATOR_DATA);

//--- set the price display precision to digits similar to the symbol prices
   IndicatorSetInteger(INDICATOR_DIGITS, _Digits);

//--- set the symbol, timeframe, period and smoothing applied price of the indicator as the short name
   string indicatorShortName = StringFormat("SmoothedCandles(%s, Period %d, %s)", _Symbol,
                               _maPeriod, EnumToString(_maAppliedPrice));
   IndicatorSetString(INDICATOR_SHORTNAME, indicatorShortName);
//IndicatorSetString(INDICATOR_SHORTNAME, "Smoothed Candlesticks");

//--- set line drawing to an empty value
   PlotIndexSetDouble(0, PLOT_EMPTY_VALUE, 0.0);

//--- create the maHandle of the smoothing indicator
   maHandle = iMA(_Symbol, PERIOD_CURRENT, _maPeriod, 0, MODE_SMMA, _maAppliedPrice);

//--- check if the maHandle is created or it failed
   if(maHandle == INVALID_HANDLE)
     {
      //--- creating the handle failed, output the error code
      ResetLastError();
      PrintFormat("Failed to create maHandle of the iMA for symbol %s, error code %d",
                  _Symbol, GetLastError());
      //--- we terminate the program and exit the init function
      return(false);
     }

   return(true); // return true, initialization of the indicator ok
  }
//+------------------------------------------------------------------+
After creating the 'GetInit()' function, call it in the 'OnInit()' standard indicator function so that it performs its intended task.
//+------------------------------------------------------------------+
//| Custom indicator initialization function                         |
//+------------------------------------------------------------------+
int OnInit()
  {
//--- call the custom initialization function
   if(!GetInit())
     {
      return(INIT_FAILED); //-- if initialization failed terminate the app
     }

//---
   return(INIT_SUCCEEDED);
  }
Indicator Main Iteration Function - OnCalculate()
The next task will be to code the standard 'OnCalculate(....)' function to perform all the indicator calculations. In this example, we will be using the long version of this standard function which has a total of ten parameters. This version of 'OnCalculate(...)' is based on calculations from the current timeframe timeseries. Here are the parameters that it contains:
- rates_total: Holds the total number of bars on the chart when the indicator is launched and is updated to reflect the current state of total available bars as new bars or data is loaded.
- prev_calculated: Saves the number of already processed bars at the previous call. It helps us to know which data we have already calculated or processed so that we don't have to calculate every bar on every OnCalculate(...) function call or when new bars arrive. OnCalculate(..) returns an updated version of this variable on every call.
- time, open, high, low, close, tick_volume, volume, and spread: It is easy to tell what these arrays hold as their names represent what bar data they store and save. Our custom indicator will be dependent on the data from these arrays and it will demonstrate how to utilize them, especially for a candlestick-based indicator like ours.
Add the OnCalculate(...) function body to our code as it contains all the relevant calculations for the plotting of the smoothed multi-color candles and smoothing line.
//+------------------------------------------------------------------+
//| Custom indicator iteration function                              |
//+------------------------------------------------------------------+
int OnCalculate(const int rates_total,
                const int prev_calculated,
                const datetime &time[],
                const double &open[],
                const double &high[],
                const double &low[],
                const double &close[],
                const long &tick_volume[],
                const long &volume[],
                const int &spread[])
  {
//--- declare a int to save the number of values copied from the iMA indicator
   int iMA_valuesToCopy;

//--- find the number of values already calculated in the indicator
   int iMA_calculated = BarsCalculated(maHandle);
   if(iMA_calculated <= 0)
     {
      PrintFormat("BarsCalculated() for iMA handle returned %d, error code %d", iMA_calculated, GetLastError());
      return(0);
     }

   int start;
//--- check if it's the indicators first call of OnCalculate() or we have some new uncalculated data
   if(prev_calculated == 0)
     {
      //--- set all the buffers to the first index
      lowBuffer[0] = low[0];
      highBuffer[0] = high[0];
      openBuffer[0] = open[0];
      closeBuffer[0] = close[0];
      start = 1;


      if(iMA_calculated > rates_total)
         iMA_valuesToCopy = rates_total;
      else   //--- copy the calculated bars which are less than the indicator buffers data
         iMA_valuesToCopy = iMA_calculated;
     }
   else
      start = prev_calculated - 1;

   iMA_valuesToCopy = (rates_total - prev_calculated) + 1;

//--- fill the iMA_Buffer array with values of the Moving Average indicator
//--- reset error code
   ResetLastError();
//--- copy a part of iMA_Buffer array with data in the zero index of the the indicator buffer
   if(CopyBuffer(maHandle, 0, 0, iMA_valuesToCopy, iMA_Buffer) < 0)
     {
      //--- if the copying fails, print the error code
      PrintFormat("Failed to copy data from the iMA indicator, error code %d", GetLastError());
      //--- exit the function with zero result to specify that the indicator calculations were not executed
      return(0);
     }

//--- iterate through the main calculations loop and execute all the calculations
   for(int x = start; x < rates_total && !IsStopped(); x++)
     {
      //--- save all the candle array prices in new non-array variables for quick access
      double candleOpen = open[x];
      double candleClose = close[x];
      double candleHigh = high[x];
      double candleLow  = low[x];

      lowBuffer[x] = candleLow;
      highBuffer[x] = candleHigh;
      openBuffer[x] = candleOpen;
      closeBuffer[x] = candleClose;

      //--- scan for the different trends signals and set the required candle color
      candleColorBuffer[x] = 2.0; // set color clrDarkGray - default (signal for no established trend)
      if(candleOpen > iMA_Buffer[x] && candleClose > iMA_Buffer[x] && candleHigh > iMA_Buffer[x] && candleLow > iMA_Buffer[x])
         candleColorBuffer[x]=0.0; // set color clrDodgerBlue - signal for a long/buy trend

      if(candleOpen < iMA_Buffer[x] && candleClose < iMA_Buffer[x] && candleHigh < iMA_Buffer[x] && candleLow < iMA_Buffer[x])
         candleColorBuffer[x]=1.0; // set color clrTomato - signal for a short/sell trend
     }

//--- return the rates_total which includes the prev_calculated value for the next call
   return(rates_total);
  }
Indicator Deinitialization Function - OnDeinit()
The last function is the 'OnDeinit()' standard function for deinitializing all the variables and arrays that need to be freed. All the buffer arrays are managed automatically and do not need to be freed or deinitialized except for the iMA handle. To ensure that our indicator releases all unused resources when it terminates, we will use the 'IndicatorRelease()' MQL5 function to free any resources being consumed by the 'maHandle' variable.
//+------------------------------------------------------------------+
//| Indicator deinitialization function                              |
//+------------------------------------------------------------------+
void OnDeinit(const int reason)
  {
   if(maHandle != INVALID_HANDLE)
     {
      IndicatorRelease(maHandle);//-- clean up and release the iMA handle
     }
  }
//+------------------------------------------------------------------+
Our indicator is now almost complete, here are the code segments combined. Ensure that your code has all the different segments in this order.
//--- specify where to display the indicator
#property indicator_separate_window
//#property indicator_chart_window

//--- indicator buffers
#property indicator_buffers 6

//--- indicator plots
#property indicator_plots   2

//--- plots1 details for the smoothed candles
#property indicator_type1   DRAW_COLOR_CANDLES
#property indicator_color1  clrDodgerBlue, clrTomato, clrDarkGray
#property indicator_label1  "Smoothed Candle Open;Smoothed Candle High;Smoothed Candle Low;Smoothed Candle Close;"

//--- plots2 details for the smoothing line
#property indicator_label2  "Smoothing Line"
#property indicator_type2   DRAW_LINE
#property indicator_color2  clrGoldenrod
#property indicator_style2  STYLE_SOLID
#property indicator_width2  2

//--- user input parameters for the moving averages
input int                _maPeriod = 50;                    // Period
input ENUM_APPLIED_PRICE _maAppliedPrice = PRICE_CLOSE;     // Applied Price

//--- indicator buffers
double openBuffer[];
double highBuffer[];
double lowBuffer[];
double closeBuffer[];
double candleColorBuffer[];

//Moving average dynamic array (buffer) and variables
double iMA_Buffer[];
int maHandle; //stores the handle of the iMA indicator

//--- integer to store the number of values in the moving average indicator
int barsCalculated = 0;

//+------------------------------------------------------------------+
//| Custom indicator initialization function                         |
//+------------------------------------------------------------------+
int OnInit()
  {
//--- call the custom initialization function
   if(!GetInit())
     {
      return(INIT_FAILED); //-- if initialization failed terminate the app
     }

//---
   return(INIT_SUCCEEDED);
  }

//+------------------------------------------------------------------+
//| Custom indicator iteration function                              |
//+------------------------------------------------------------------+
int OnCalculate(const int rates_total,
                const int prev_calculated,
                const datetime &time[],
                const double &open[],
                const double &high[],
                const double &low[],
                const double &close[],
                const long &tick_volume[],
                const long &volume[],
                const int &spread[])
  {
//--- declare a int to save the number of values copied from the iMA indicator
   int iMA_valuesToCopy;

//--- find the number of values already calculated in the indicator
   int iMA_calculated = BarsCalculated(maHandle);
   if(iMA_calculated <= 0)
     {
      PrintFormat("BarsCalculated() for iMA handle returned %d, error code %d", iMA_calculated, GetLastError());
      return(0);
     }

   int start;
//--- check if it's the indicators first call of OnCalculate() or we have some new uncalculated data
   if(prev_calculated == 0)
     {
      //--- set all the buffers to the first index
      lowBuffer[0] = low[0];
      highBuffer[0] = high[0];
      openBuffer[0] = open[0];
      closeBuffer[0] = close[0];
      start = 1;


      if(iMA_calculated > rates_total)
         iMA_valuesToCopy = rates_total;
      else   //--- copy the calculated bars which are less than the indicator buffers data
         iMA_valuesToCopy = iMA_calculated;
     }
   else
      start = prev_calculated - 1;

   iMA_valuesToCopy = (rates_total - prev_calculated) + 1;

//--- fill the iMA_Buffer array with values of the Moving Average indicator
//--- reset error code
   ResetLastError();
//--- copy a part of iMA_Buffer array with data in the zero index of the the indicator buffer
   if(CopyBuffer(maHandle, 0, 0, iMA_valuesToCopy, iMA_Buffer) < 0)
     {
      //--- if the copying fails, print the error code
      PrintFormat("Failed to copy data from the iMA indicator, error code %d", GetLastError());
      //--- exit the function with zero result to specify that the indicator calculations were not executed
      return(0);
     }

//--- iterate through the main calculations loop and execute all the calculations
   for(int x = start; x < rates_total && !IsStopped(); x++)
     {
      //--- save all the candle array prices in new non-array variables for quick access
      double candleOpen = open[x];
      double candleClose = close[x];
      double candleHigh = high[x];
      double candleLow  = low[x];

      lowBuffer[x] = candleLow;
      highBuffer[x] = candleHigh;
      openBuffer[x] = candleOpen;
      closeBuffer[x] = candleClose;

      //--- scan for the different trends signals and set the required candle color
      candleColorBuffer[x] = 2.0; // set color clrDarkGray - default (signal for no established trend)
      if(candleOpen > iMA_Buffer[x] && candleClose > iMA_Buffer[x] && candleHigh > iMA_Buffer[x] && candleLow > iMA_Buffer[x])
         candleColorBuffer[x]=0.0; // set color clrDodgerBlue - signal for a long/buy trend

      if(candleOpen < iMA_Buffer[x] && candleClose < iMA_Buffer[x] && candleHigh < iMA_Buffer[x] && candleLow < iMA_Buffer[x])
         candleColorBuffer[x]=1.0; // set color clrTomato - signal for a short/sell trend
     }

//--- return the rates_total which includes the prev_calculated value for the next call
   return(rates_total);
  }

//+------------------------------------------------------------------+
//| Indicator deinitialization function                              |
//+------------------------------------------------------------------+
void OnDeinit(const int reason)
  {
   if(maHandle != INVALID_HANDLE)
     {
      IndicatorRelease(maHandle);//-- clean up and release the iMA handle
     }
  }
//+------------------------------------------------------------------+

//+------------------------------------------------------------------+
//| User custom function for custom indicator initialization         |
//+------------------------------------------------------------------+
bool GetInit()
  {
//--- set the indicator buffer mapping by assigning the indicator buffer array
   SetIndexBuffer(0, openBuffer, INDICATOR_DATA);
   SetIndexBuffer(1, highBuffer, INDICATOR_DATA);
   SetIndexBuffer(2, lowBuffer, INDICATOR_DATA);
   SetIndexBuffer(3, closeBuffer, INDICATOR_DATA);
   SetIndexBuffer(4, candleColorBuffer, INDICATOR_COLOR_INDEX);

//--- buffer for iMA
   SetIndexBuffer(5, iMA_Buffer, INDICATOR_DATA);

//--- set the price display precision to digits similar to the symbol prices
   IndicatorSetInteger(INDICATOR_DIGITS, _Digits);

//--- set the symbol, timeframe, period and smoothing applied price of the indicator as the short name
   string indicatorShortName = StringFormat("SmoothedCandles(%s, Period %d, %s)", _Symbol,
                               _maPeriod, EnumToString(_maAppliedPrice));
   IndicatorSetString(INDICATOR_SHORTNAME, indicatorShortName);
//IndicatorSetString(INDICATOR_SHORTNAME, "Smoothed Candlesticks");

//--- set line drawing to an empty value
   PlotIndexSetDouble(0, PLOT_EMPTY_VALUE, 0.0);

//--- create the maHandle of the smoothing indicator
   maHandle = iMA(_Symbol, PERIOD_CURRENT, _maPeriod, 0, MODE_SMMA, _maAppliedPrice);

//--- check if the maHandle is created or it failed
   if(maHandle == INVALID_HANDLE)
     {
      //--- creating the handle failed, output the error code
      ResetLastError();
      PrintFormat("Failed to create maHandle of the iMA for symbol %s, error code %d",
                  _Symbol, GetLastError());
      //--- we terminate the program and exit the init function
      return(false);
     }

   return(true); // return true, initialization of the indicator ok
  }
//+------------------------------------------------------------------+
Save and compile the indicator code and it compiles with no errors or warnings. Load it in MetaTrader 5 and test how it performs using different user input parameters.
Conclusion
In this article, you have learned what indicators are, the various types of indicators found in the MetaTrader 5 platform, the different components and building blocks of custom indicators, and gotten first-hand practical experience by developing a few custom indicators with MQL5 from scratch.
Developing custom indicators with MQL5 is a complex topic that can not be fully exhausted in a single article, so we'll continue covering more advanced areas in upcoming articles. With the knowledge you have gained from this article guide, you're now capable of developing your own simple custom indicators. I challenge you to keep practicing your programming skills and wish you all the best in your coding journey.
 Developing a Replay System (Part 38): Paving the Path (II)
 Developing an MQL5 RL agent with RestAPI integration (Part 2): MQL5 functions for HTTP interaction with the tic-tac-toe game REST API
 Data Science and ML (Part 22): Leveraging Autoencoders Neural Networks for Smarter Trades by Moving from Noise to Signal
 MQL5 Wizard Techniques you should know (Part 17): Multicurrency Trading
- Free trading apps
- Over 8,000 signals for copying
- Economic news for exploring financial markets
You agree to website policy and terms of use
