
Bill Williams Advanced is designed for chart analysis using Bill Williams' "Profitunity" system. The indicator analyzes the signals of the AO and AC indicators on four time frames at once and places it(signals) in the panel in the upper left corner of the chart. In addition, using hot keys, the indicator instantly displays/hides the AO and AC indicators.
The indicator is available only for the fifth version of the trading terminal:
Disclaimer:
- The indicator works only on Windows. The indicator will not work properly on a Mac.
- It will not work on instruments where there are less than 37 bars on the timeframe it analyzes.
- The indicator is available only for the fifth version of the trading terminal:
The indicator is written based on the "Profitunity" system by Bill Williams. To fully understand the logic of using the indicator, it is recommended to read the book “New Trading Dimensions” by Bill Williams. It is not recommended to use the indicator for traders unfamiliar with "Profitunity" system.
How does the indicator panel work?
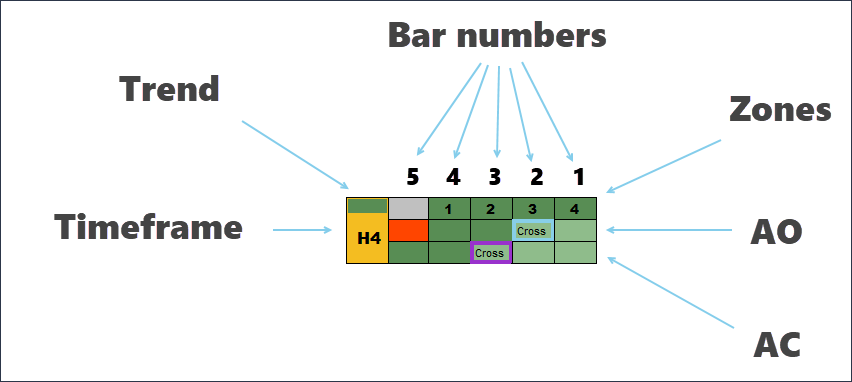
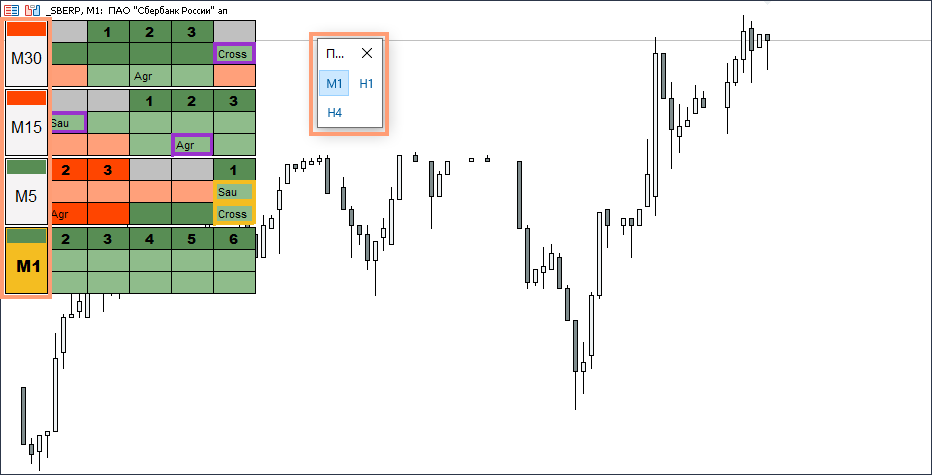
- Columns. The bars from right to left (marked with numbers) correspond to the last five closed bars on the price chart.
- 1 line. Displays signals of Zones of the "Profitunity" system.
- 2nd line. Displays signals from the AO (Awesome Oscillator) indicator.
- 3 line. Displays the signals of the AC (Accelerator Oscillator) indicator.
- Timeframe. The time frame is displayed on the left. If the timeframe is current, it is painted yellow.
- Trend(Added in latest update). It can be either green (ascending) or red (descending). Determined by the Alligator indicator.
Signal types
The "Bill Williams Advanced" indicator duplicates the classic signals of the "Profitunity" system based on the AO and AC indicators. All signals on the indicator panel are determined by closed bars. There are three types of such signals: Zone signals, AO signals, AC signals.
- The red zone is a situation where the AO and AC indicators simultaneously move in a downward direction and form red bars at the moment the bars close.
- The green zone is a situation where the AO and AC indicators simultaneously move in an upward direction and form green bars at the moment the bars close.
- The gray zone is a situation where the AO and AC indicators move in different directions. For example, AC might be green and AO might be red.

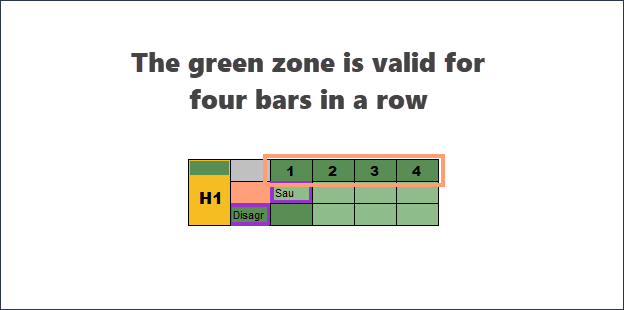
1.1 Zone duration
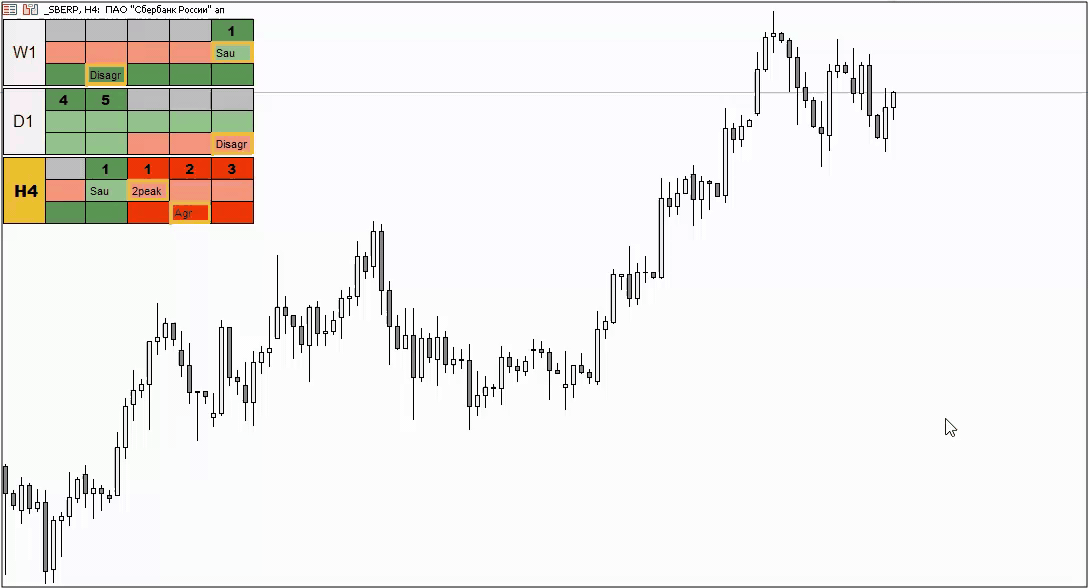
The duration of the formation of the zone is marked with numbers: 1 - the first bar of the zone, 2 - the second bar of the zone, etc. Only red and green zones are marked with numbers; the gray zone (absence of a trend) is not marked in any way. In the example below, the indicator indicated a strong uptrend (the green zone lasted 4 bars in a row).
2. AO signals
Within the "Profitunity" system there are three types of signals that the AO indicator gives:
- "Saucer" - marked on the indicator panel as "Sau"
- "Crossing the zero line" - marked on the indicator panel as "Cross"
- "Two peaks" - marked on the indicator panel as "2peak"
Below you can see the daily Bitcoin chart, where the “Two Peaks” signal was formed on the AO indicator. As can be seen on the panel, the signal was formed on the second closed bar. In addition, we see that on the next bar we received the second bar of the Red Zone.
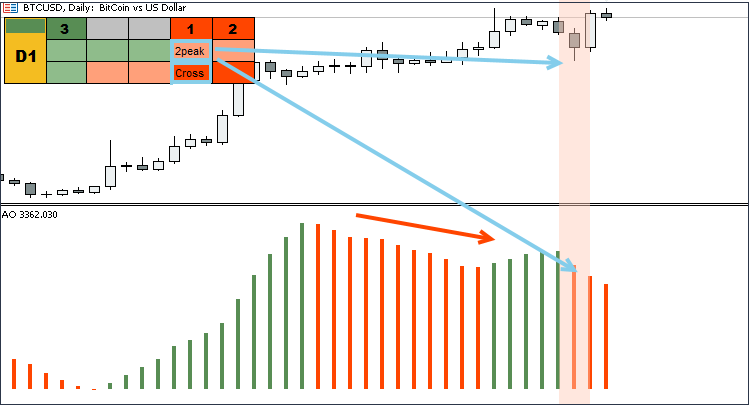
To trade AO signals, the Profitunity system recommends using pending orders. For example, in the picture above, it would be necessary to place a Sell Stop below the low of the signal bar.
The "2 peaks" signal in the picture above is a reversal signal and can be traded both with the trend and against the trend.
The remaining signals (“Crossing the zero line” and “Saucer”) are recommended to be traded only along the trend, which is determined using the “Alligator” indicator.
Exceptions to the rules (when you can trade a countertrend):
- “5 bullets that kill a trend” is a setup that appears at the moment of reversal of major movements.
3. AC signals
The AC indicator also gives three types of signals:
- "Crossing the zero line" - marked on the indicator panel as "Cross"
- "Buying or selling in accordance with the driving force" - marked on the indicator panel as "Agr"
- "Buying or selling in disagreement with the driving force" - marked on the indicator panel as "Disagr"
As with AO, the direction of the signal is indicated by color. For example, if a signal appears in a red box, then it is for sale, and if in a green box, it is for buy.
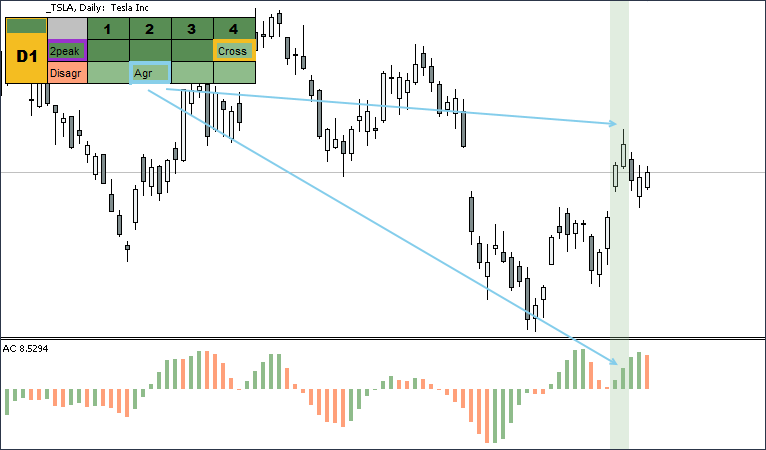
In the example below, the AC indicator contains the signal “Buy in accordance with the driving force" - “Agr” on the indicator panel.
Within the "Profitunity" system, AC indicator signals are recommended to trade in the direction of the trend, which is determined using the "Alligator" indicator.
Exceptions to the rules (when you can trade a countertrend):
- The situation when the AC signal coincides with the “2 peaks” reversal signal on the AO indicator.
- “5 bullets that kill a trend” is a setup that appears at the moment of reversal of major movements.
Outlining cells with signals
On the indicator panel, cells with signals are outlined in different colors. This was done in order to distinguish triggered signals from those that have not yet triggered.
Yellow outline - The signal has been formed and can be used (place a pending order beyond the high or low of the signal bar).

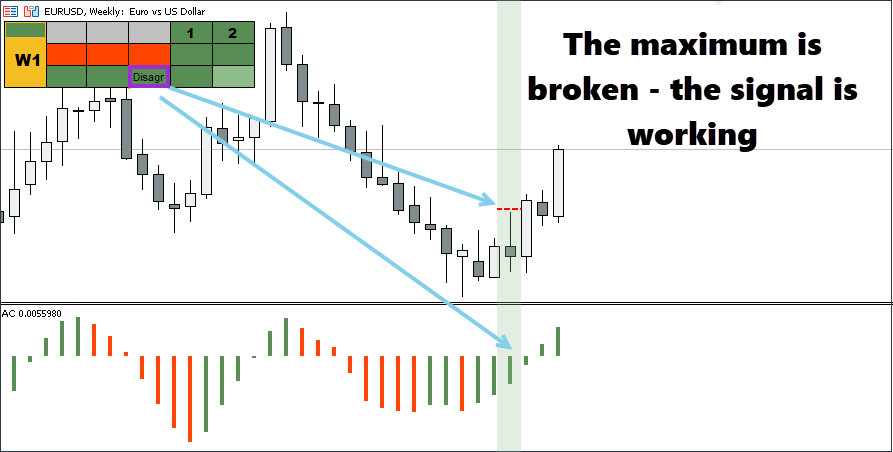
In the example below, a “Buy in disagreement with the driving force” signal was generated on AC. The maximum of the signal candle was broken, indicating activation of the signal. After breaking through the maximum, the signal turned purple on the indicator panel.

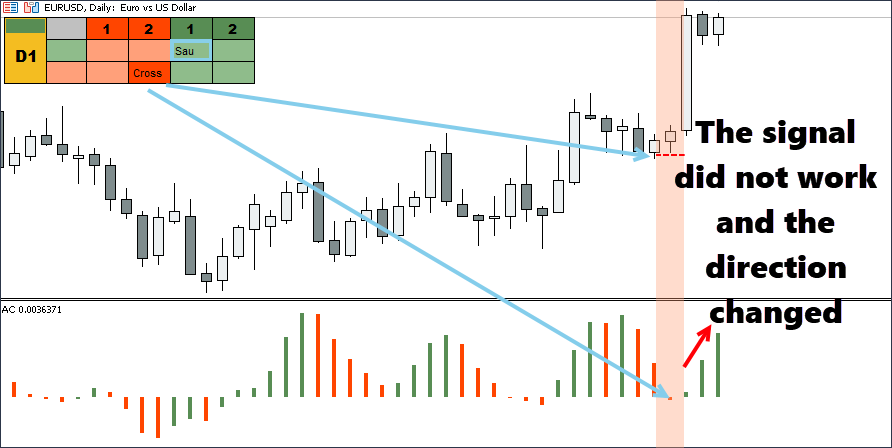
In the example above, on a downward signal candle, we generated two signals at once: “Two peaks” by AO and “Crossing the zero line” by AC. The "Profitunity" system involves the use of a pending order "Sell Stop" at the low of the signal candle. As can be seen in the example above, the next candle after the signal one did not break through the low of the signal candle, but closed higher, while maintaining the sales direction on the AO and AC oscillators.
The signal on the indicator panel is outlined in blue, which means that the downward signal remains, but the pending order for it can be moved beyond the low of the next (white) candle. This way we got a better entry price.
Without outline - The conditions for generating the signal are no longer relevant, or it has already served its purpose.
In the example below, a sell signal “Crossing the zero line” was generated for AO. The low of the signal bar was not broken, which means the signal did not work. After this, the AC direction changed to upward, which finally canceled the signal. In such a situation, the outline disappears.
Multi-version of the indicator
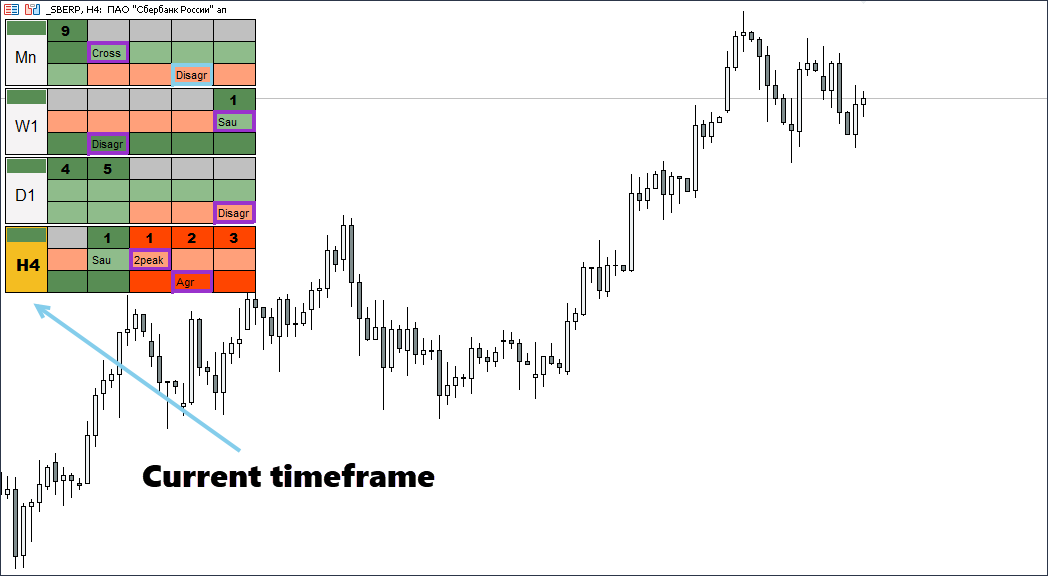
In the latest update, we added a multi-timeframe version of the indicator, which is capable of simultaneously analyzing four timeframes at once. Timeframes are arranged from bottom to top from low to high. The timeframe on which the user is currently located is painted in yellow.
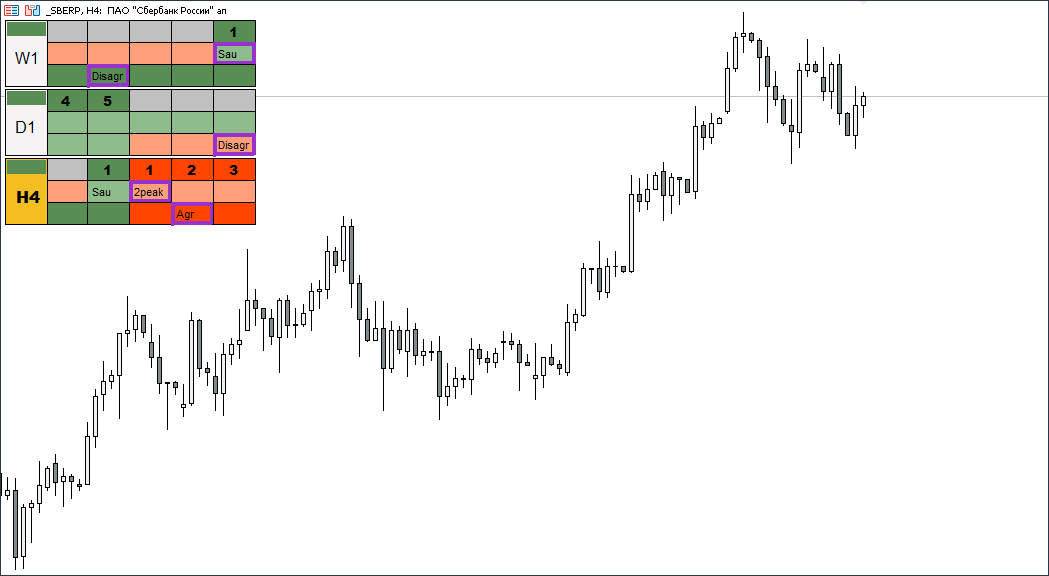
You can change the number of simultaneously analyzed timeframes. The available options are: 1, 2, 3, 4. The “TFNumber” parameter is responsible for this. In the chart below, for example, I left only three timeframes:
Classic timeframes
By default, the indicator analyzes classic timeframes: m1, m5, m15, m30, H1, H4, D1, W1, Mn.

It should be noted that the indicator takes these timeframes not from the trading terminal panel, but from its own list. Accordingly, if you remove some timeframes from the terminal panel and leave, for example, only m1, H1 and H4, then when you are on m1 the indicator will still display timeframes m1 - m5 - m15 - m30. See example below:
In the fifth version of Metatrader, in addition to standard timeframes, exotic ones were added, which significantly increased the list of timeframes. To switch to using all existing time frames, change the "classicTF" parameter to "False". In this case, the indicator will display data on the following timeframes: m1, m2, m3, m4, m5, m6, m10, m12, m15, m20, m30, H1, H2, H3, H4, H6, H8, H12, D1, W1 , Mn. See example below:

As in the situation with classic timeframes, the indicator also takes information on all possible timeframes from its own list, and does not adapt to the user’s configured terminal. Therefore, you have two possible options for displaying indicator signals:
- m1, m5, m15, m30, H1, H4, D1, W1, Mn
- m1, m2, m3, m4, m5, m6, m10, m12, m15, m20, m30, H1, H2, H3, H4, H6, H8, H12, D1, W1, Mn
Hotkey combinations
The main task of the "Bill Williams Advanced" indicator is to simplify the analysis as much as possible and remove all unnecessary things from the chart. For example, when using our indicator, there is practically no need for the AO and AC indicators, because their signals are already copied to the panel at the top of the screen.
But you shouldn’t completely abandon AO and AC. The AO indicator can be useful, for example, to determine the potential for divergence. That is why we have implemented a system in which the AO and AC indicators are not on the chart by default, but they can be displayed/hidden using hotkeys.
- "Shift + E" - Display the AO indicator on the chart
- "Shift + R" - Display the AC indicator on the chart
- "Shift + Q" - Display the AO and AC indicators on the chart
- "Shift + W" - Hide AO and AC indicators
In the picture below you can see how this function works:
After activating the hotkeys for the first time, you can customize the appearance of the AO and AC indicators. After the first setup, all subsequent times they will be displayed already painted in the colors you need.
First loading of the indicator. Quotes
For the multi-timeframe version of the indicator to work correctly, it needs instrument quotes. If you have been analyzing and trading on any instrument for a long time, then there will be no problems. The indicator will immediately install and display all signals.
But if you drag an instrument whose quotes are not available in the trading terminal onto a chart with an indicator, then during the loading process the indicator may display incorrect information. When they are fully loaded, the indicator’s operation returns to normal.
Minimum trading instruments requirements
In order for the indicator to work properly, it needs to have at least 37 bars on the chart of each analyzed time frame. These are the minimum requirements for the AO and AC indicators to operate. If on one of the timeframes there are less than 37 bars, the indicator will not work normally, since it will have nowhere to take data for analysis.This problem can occur in futures contracts, where most of the time the required number of bars on the monthly and weekly charts for the AO and AC indicators are missing.
External parameters:
Author: Siarhei Vashchylka. For any questions, write to me in private messages. I also recommend subscribing to my updates. To do this, follow the link to my profile and click "Add to friends".


