ETHUSD: Double Bottom Pattern Above $1462
Ethereum was unable to sustain its bearish momentum and after touching a low of $1462 on 13th Feb, the price started to correct upwards against the US dollar now ranging above the $1650 handle today in the Asian trading session.
We can see a continuous escalation in the price of Ethereum which is expected to push up its price above the $1700 handle.
The price of ETH has touched a new record high of 5 months.
We can clearly see a double bottom pattern above the $1462 handle which is a bullish pattern and signifies the end of a bearish phase and the start of a bullish phase in the markets.
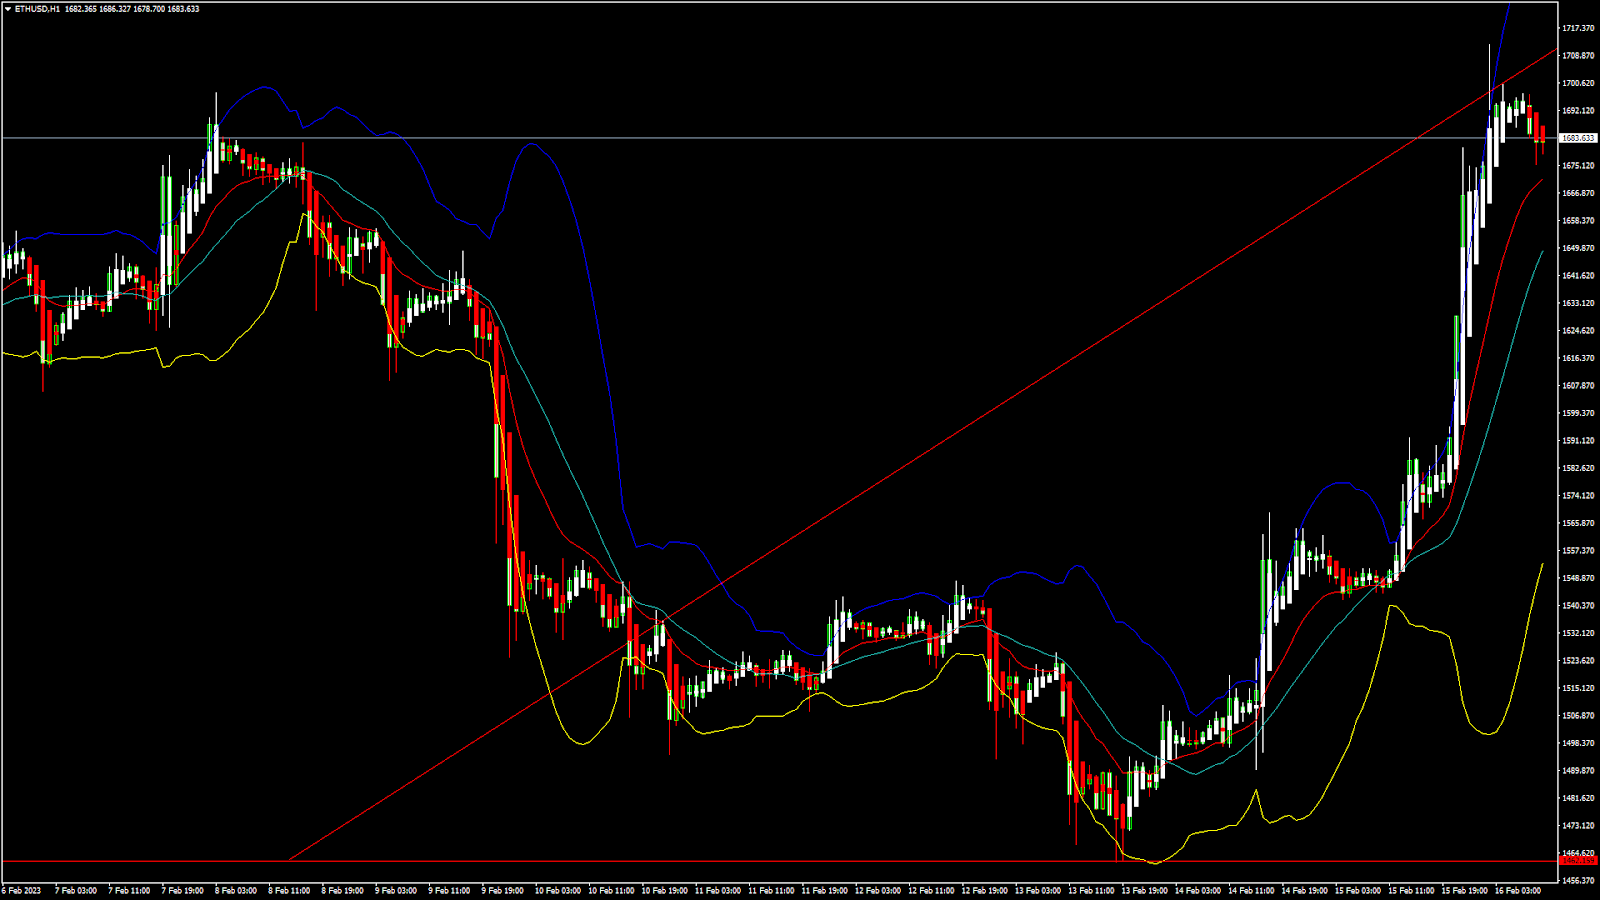
ETH is now trading just above its pivot level of 1681 and moving into a strongly bullish channel. The price of ETHUSD is now testing its classic resistance level of 1687 and Fibonacci resistance level of 1693 after which the path towards 1800 will get cleared.
We can see the formation of bullish engulfing lines in the weekly time frame.
The relative strength index is at 75.92 indicating a very strong demand for Ether and the continuation of the buying pressure in the markets.
The RSI is giving an overbought signal, which means that the price is expected to decline in the short-term range.
Most of the technical indicators are giving a STRONG BUY market signal.
Most of the moving averages are giving a STRONG BUY signal at the current market level of $1683.
ETH is now trading above both the 100 hourly simple and 100 hourly exponential moving averages.
- Ether: bullish reversal seen above the $1462 mark.
- The short-term range appears to be strongly bullish.
- ETH continues to remain above the $1650 level.
- The average true range is indicating LESS market volatility. ...More info: blog FXOpen
Ether: Bullish Reversal Seen Above $1462