ETHUSD: Double Bottom Pattern Above $1,725
Ethereum was unable to sustain its bearish momentum this week and after touching a low of 1,725 on 07th June started to correct upwards against the US dollar.
We can see a strong pullback action in the markets which is keeping the prices of Ethereum above the $1,800 handle in the European trading session today.
We can see the formation of a bullish ascending channel above the $1,800 handle, and now we are looking at $1,900 and $2,050 as the immediate targets.
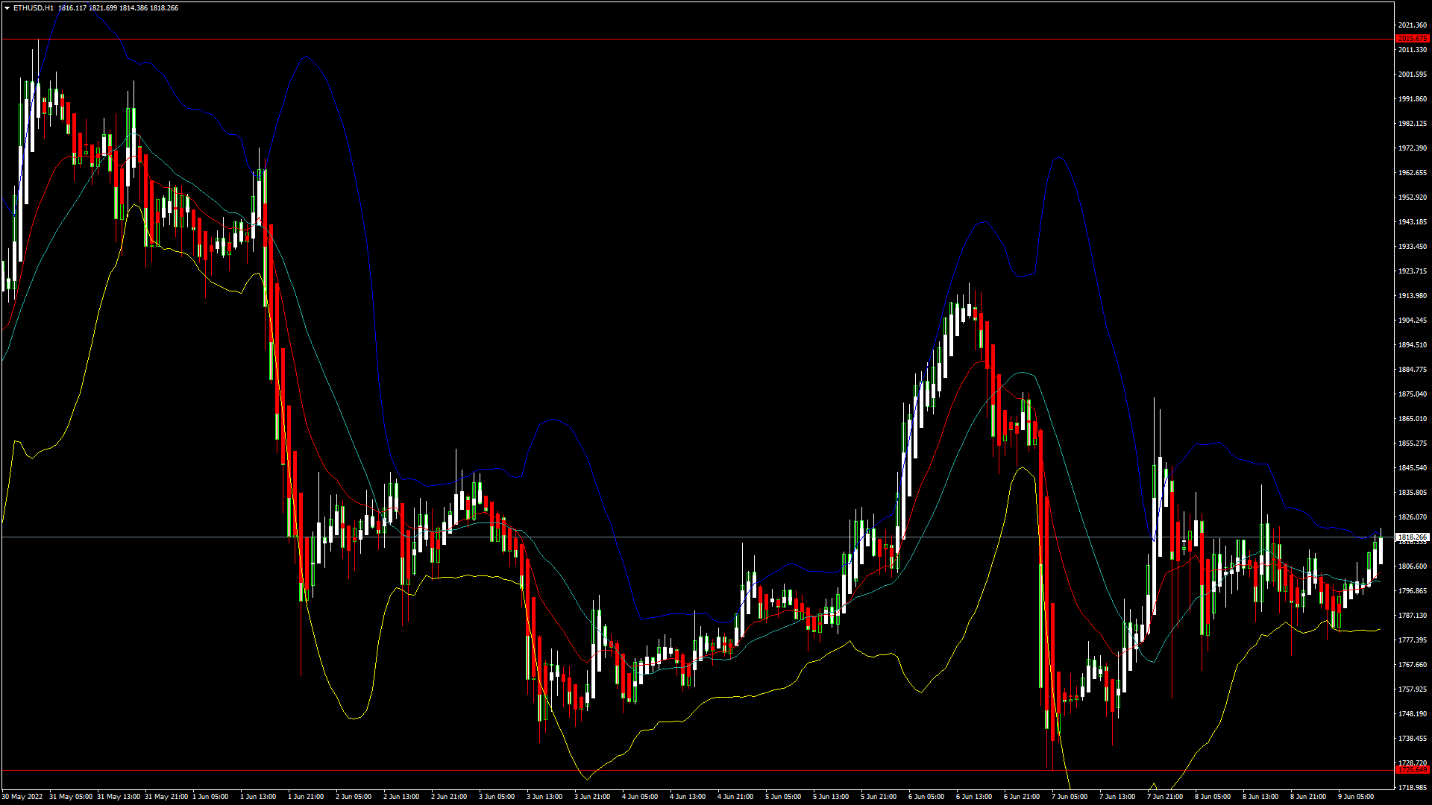
The prices touched an intraday low of $1,777 in the Asian trading session, and an intraday high of $1,821 in the European trading session today.
We can clearly see a double bottom pattern above the $1,725 handle which is a bullish pattern and signifies the end of a bearish phase and the start of a bullish phase in the markets.
ETH is now trading just above its pivot level of 1,814 and moving in a strongly bullish channel. The price of ETHUSD is now testing its classic resistance level of 1,820 and Fibonacci resistance level of 1,825, after which the path towards 1,900 will get cleared.
The relative strength index is at 58 indicating a strong market and the continuation of the uptrend this week.
The StochRSI and Williams percent range are indicating an oversold level which means that the price is due to correct upwards in the short-term range.
..More info: blog FXOpen