Many are wondering how to trade the signals of the AB = CD pattern correctly. It's very simple. The name AB = CD speaks for itself. The measured distance of the CD on the chart should be equal to the distance AB. Then many will ask, why are Fibonacci projection levels needed in this pattern? ... There are two ways trade to the AB = CD pattern, which will be discussed below. I will consider everything using the example of the Harmonic ABCD Universal indicator. And for those who need to see the full picture of the market, there is the Harmonic ABCD Monitor MT5 indicator, which allows your to see AB = CD patterns on a variety of currency pairs and timeframes that can be set in the indicator settings. For automatic and semi-automatic trading using the AB = CD pattern, there are Expert Advisors, Harmonic ABCD Wizard MT4 (for MetaTrader 4) and Harmonic ABCD Wizard (for MetaTrader 5). So, I'll tell your about the pattern itself.
Pattern levels AB = CD
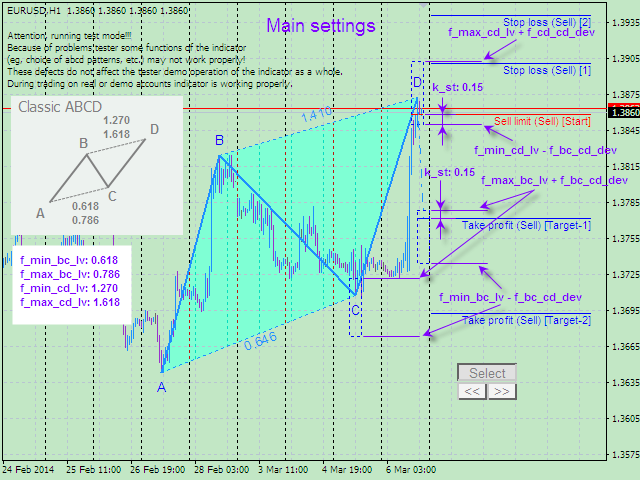
In this illustration, your can see the projection levels of the BC movement relative to the AB movement. They are in the range, from 0.618 to 0.786. And the projection of the CD movement relative to the AB movement, the range of which is from 1.270 to 1.618. These are standard projections of the AB = CD pattern, based on Fibonacci levels. How to trade based on these levels? ... There are two methods.
Trading on AB = CD in the projections range
This is the easiest way. To trade on it, your need the BC movement, relative to the AB movement, to fall within the 0.618 - 0.786 projections range. And the movement of CD relative to the movement of AB, fell into the range of 1.270 - 1.618, respectively. The indicators listed above can easily cope with this task. Use the Harmonic ABCD Monitor MT5 indicator if your need to see all patterns at the same time on a variety of trading instruments and timeframes. So, all the movements fell into the required ranges. What's next?... Next, we measure the movement of the CD in points. If it is approximately equal to the AB movement, then such a pattern is suitable for entering in the market. To do this, your can stretch the rectangle on the AB motion and try on it to the CD motion (as shown below in the gif animation).
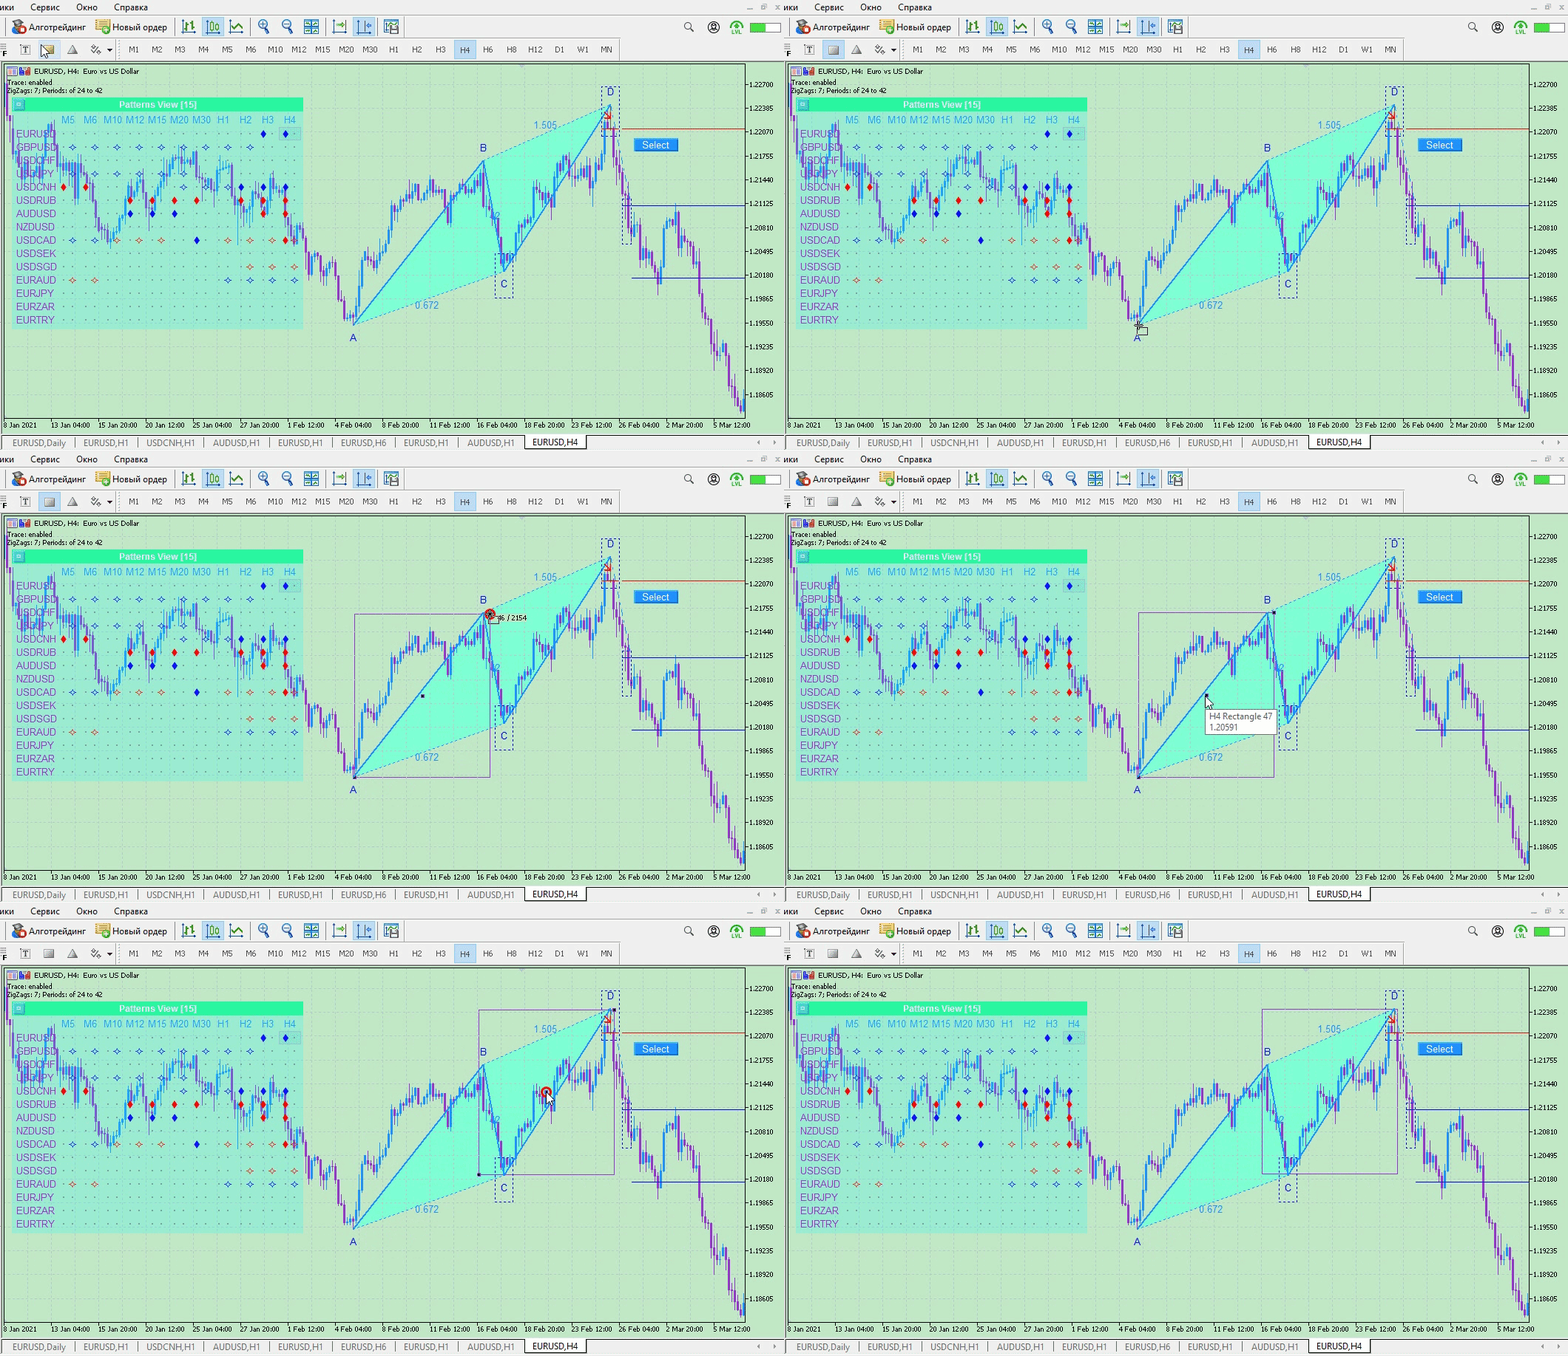
If your trade using limit orders, then your need to make sure that the CD movement does not differ too much from the AB movement. And if it starts to differ too much (the price moves far from the level), then close the deal.
Accurate signals of the AB = CD pattern
This principle consists in trading strictly according to the levels, BC ~ 0.618, CD ~ 1.618 and, BC ~ 0.786, CD ~ 1.270, respectively. But such cases are much less common in comparison with the first method discussed above. Let's consider everything with practical examples.
First variant
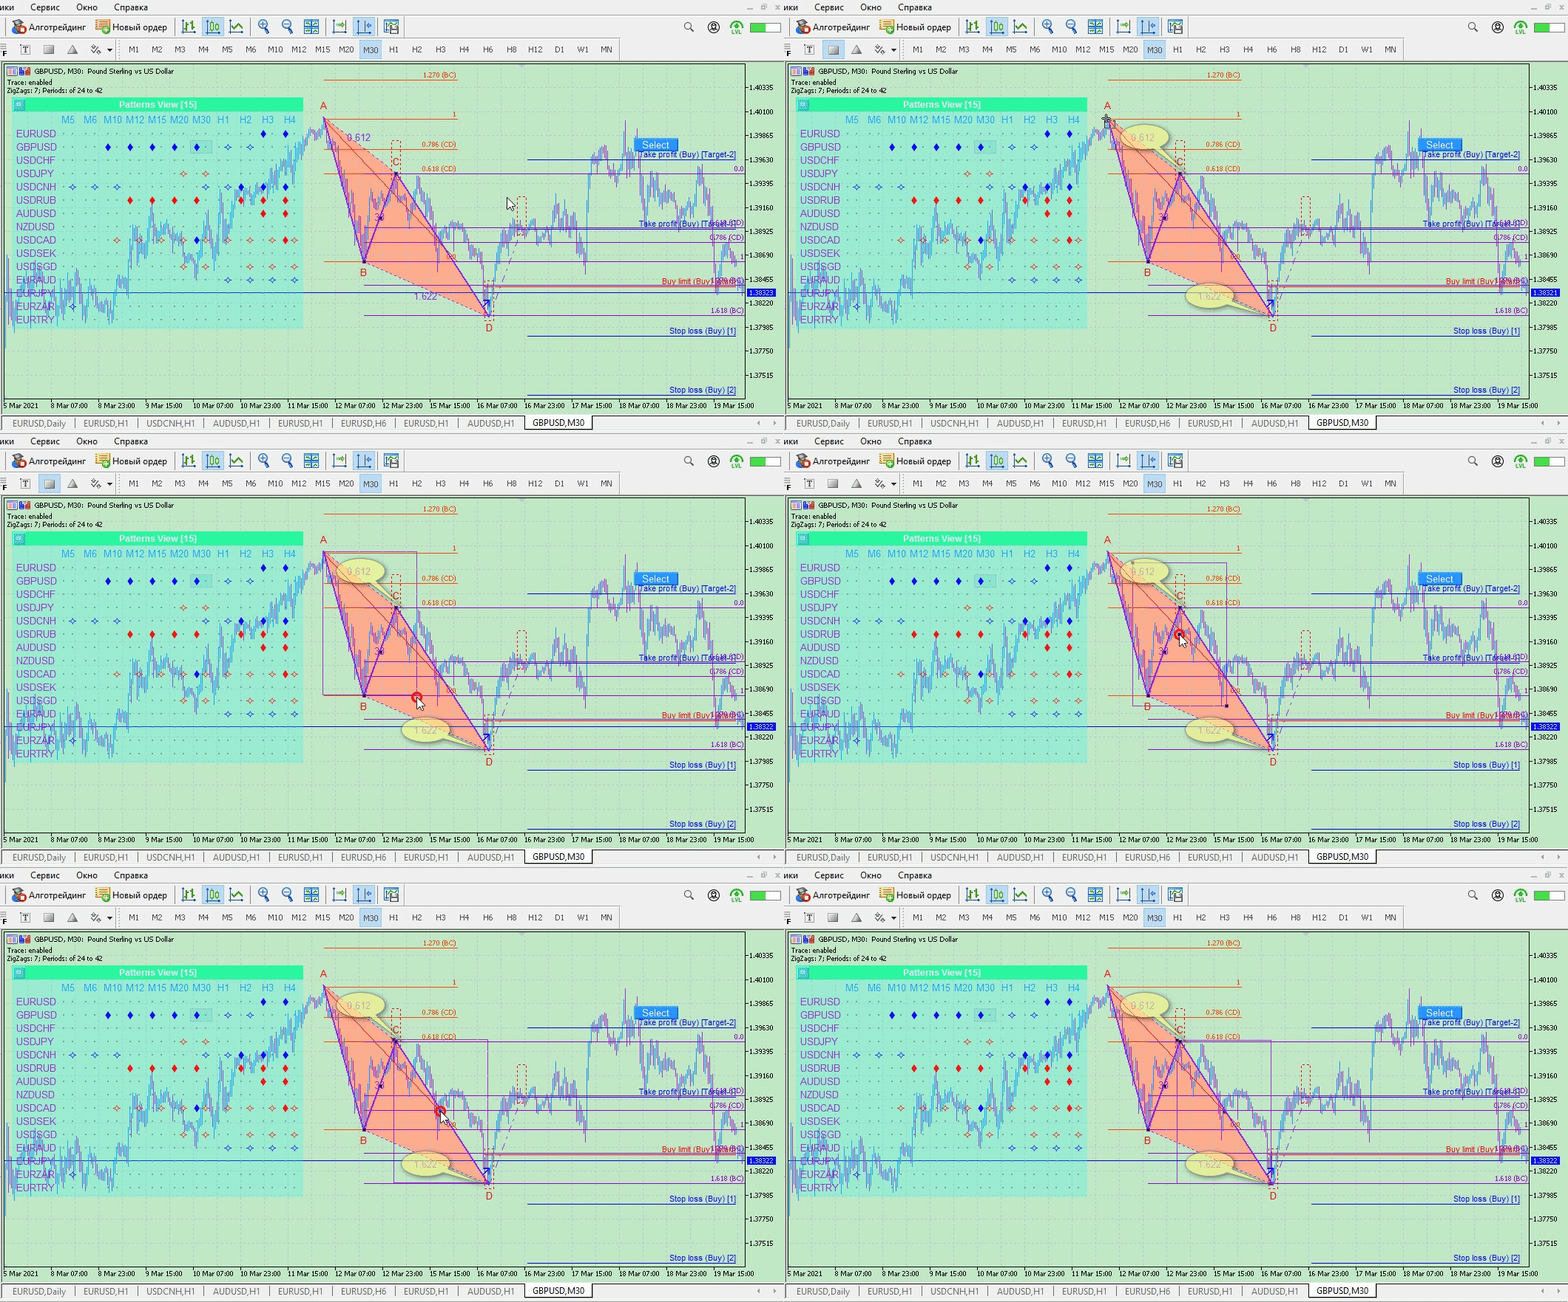
In this example, your can see the projections of the pattern BC: 0.612 and CD: 1.622, which in this case shows us the Harmonic ABCD Monitor MT5 indicator, with which your can find any AB = CD patterns without much difficulty. This is very close to the levels 0.618 and 1.618. Therefore, such a pattern can be considered valid. To additionally check the projections, two standard "Fibonacci retracement" tools were added to the chart, and checking was performed using the "Rectangle", which is already familiar to us in the above described way. The example shows that the pattern worked pretty well. The price has reached the levels [Target-1] and [Target-2].
Second variant
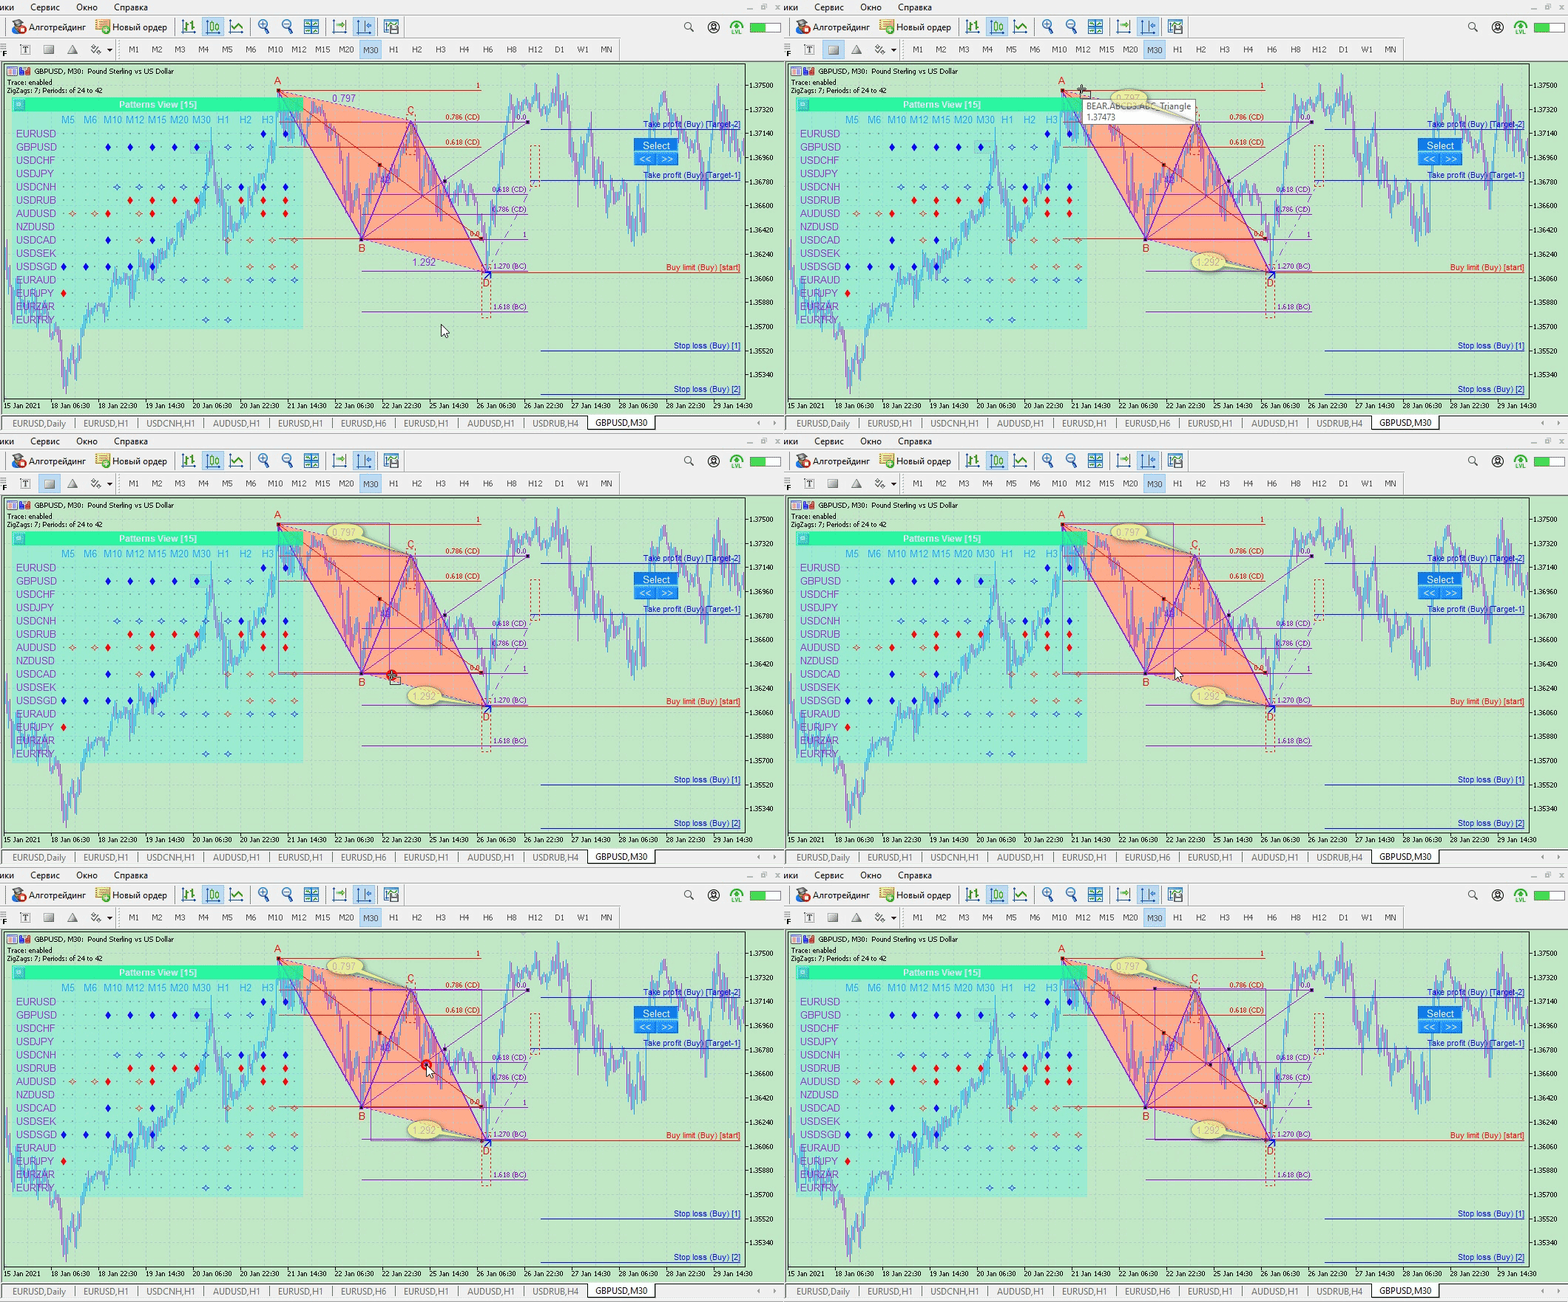
The projections here are BC: 0.797 and CD: 1.292, which is pretty close to the 0.786 and 1.270 levels. Therefore, such a pattern can also be considered valid. We look at the further price movement and see that it quickly reached two levels, [Target-1] and [Target-2].
Trading with AB = CD signals on pullbacks
The best way to trade pattern AB = CD signals is when the pattern appears on a pullback. Then the trader has a good chance to enter at the very beginning of the movement, with minimal risk and a good chance that the price will reach all the required levels and even more. Therefore, it makes sense to follow the movement that was before the appearance of the pattern AB = CD. Let's look at an example.
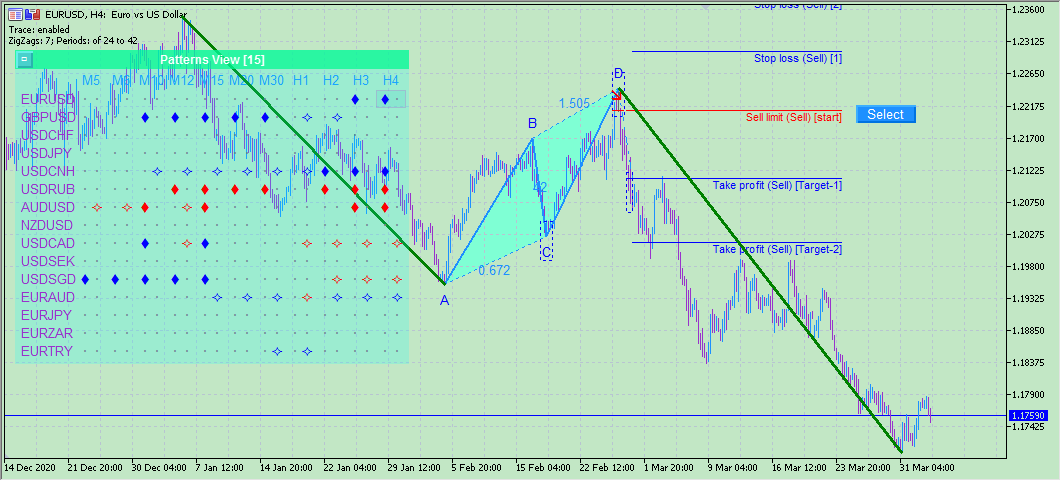
This screenshot shows the AB = CD pattern. Pay attention to the movement that precedes it (green trend line). And then see how the price worked. If your enter at point D of the pattern, then the pattern can work out by more than 200%, with the lowest possible risk. Therefore, it is best to look for AB = CD patterns on price pullbacks.


