

Elliott Wave Theory Rules
The Elliott Wave Theory is named after Ralph Nelson Elliott. Elliott concluded that the movement of the stock market could be predicted by observing and identifying a repetitive pattern of waves and is true for both Bear and Bullish trends. It is basically a common sense method of measuring herd mentality of the market traders.
Elliott Wave Theory can be very complicated with some traders and educators talking about 13 waves, inner waves, corrections and some really obtuse reasoning! This totally over complicates what is, at its core, a simple interpretation of trends. At TradeThefifth we have "Kept it Simple" by concentrating on Hard Elliott Wave rules that cannot be broken. The combined these with important observations, using simple indicators, to form an indicator suite and swing trading strategy to trade the 5th Wave of an Elliott Wave Sequence. The 5th Wave, by its nature, is the highest probability move in a trend, as all the other hard rules and majority of the important observations have been met in the lead up to a 5th wave.
This article will concentrate on the Elliott Wave Theory Hard Rules and the Observations used to form our Elliott Wave Indicator Suite and Swing Trading Strategy that holds true for what ever asset class a traders is trading. This Swing Trading Strategy has been developed and successfully used by our founder and CEO, Paul Bratby for over 16 years as both a private investor and Money Manager.
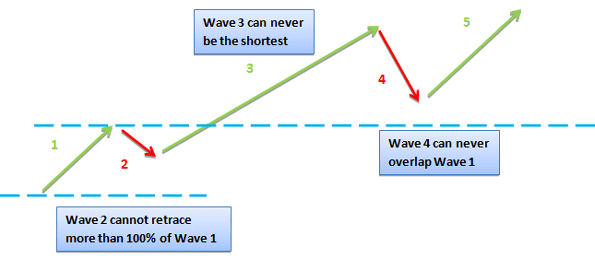
The Three Elliott Wave Theory Hard rules
1. Wave 2 cannot retrace more than 100% of Wave 1
2. Wave 3 can never be the shortest of the three impulse waves
3. Wave 4 can never overlap Wave 1
These 3 Rules are never broken and programmed into our Elliott Wave Indicator Suite as the foundation of the swing trading strategy. Next we move onto building the strategy further by adding important observations that form part of the tools/indicators of our trading software.

Elliott Wave Theory Observations important to TradeTheFifth
Observation 1
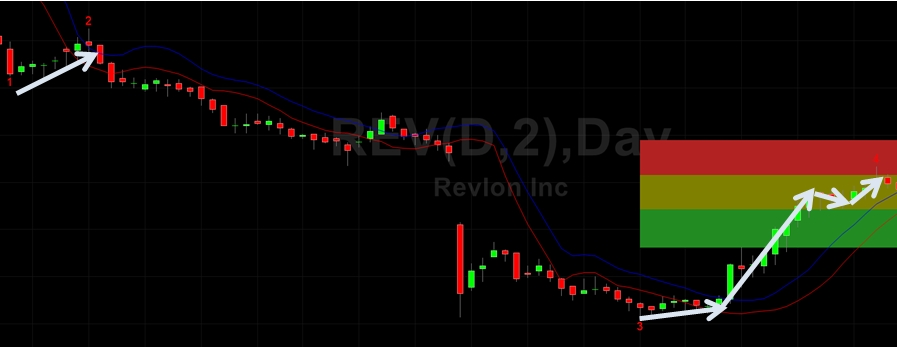
The first observation is a general Elliott Wave Theory observation and when present builds confident in the relationship between Wave 2 and Wave 4. Not forgetting the 3 Hard Rules still apply….
In many cases if Wave 2 is simple then the Wave 4 is most likely to be more complex and vice versa. The Chart Below gives a great example of this confidence building observation.
Observation 2
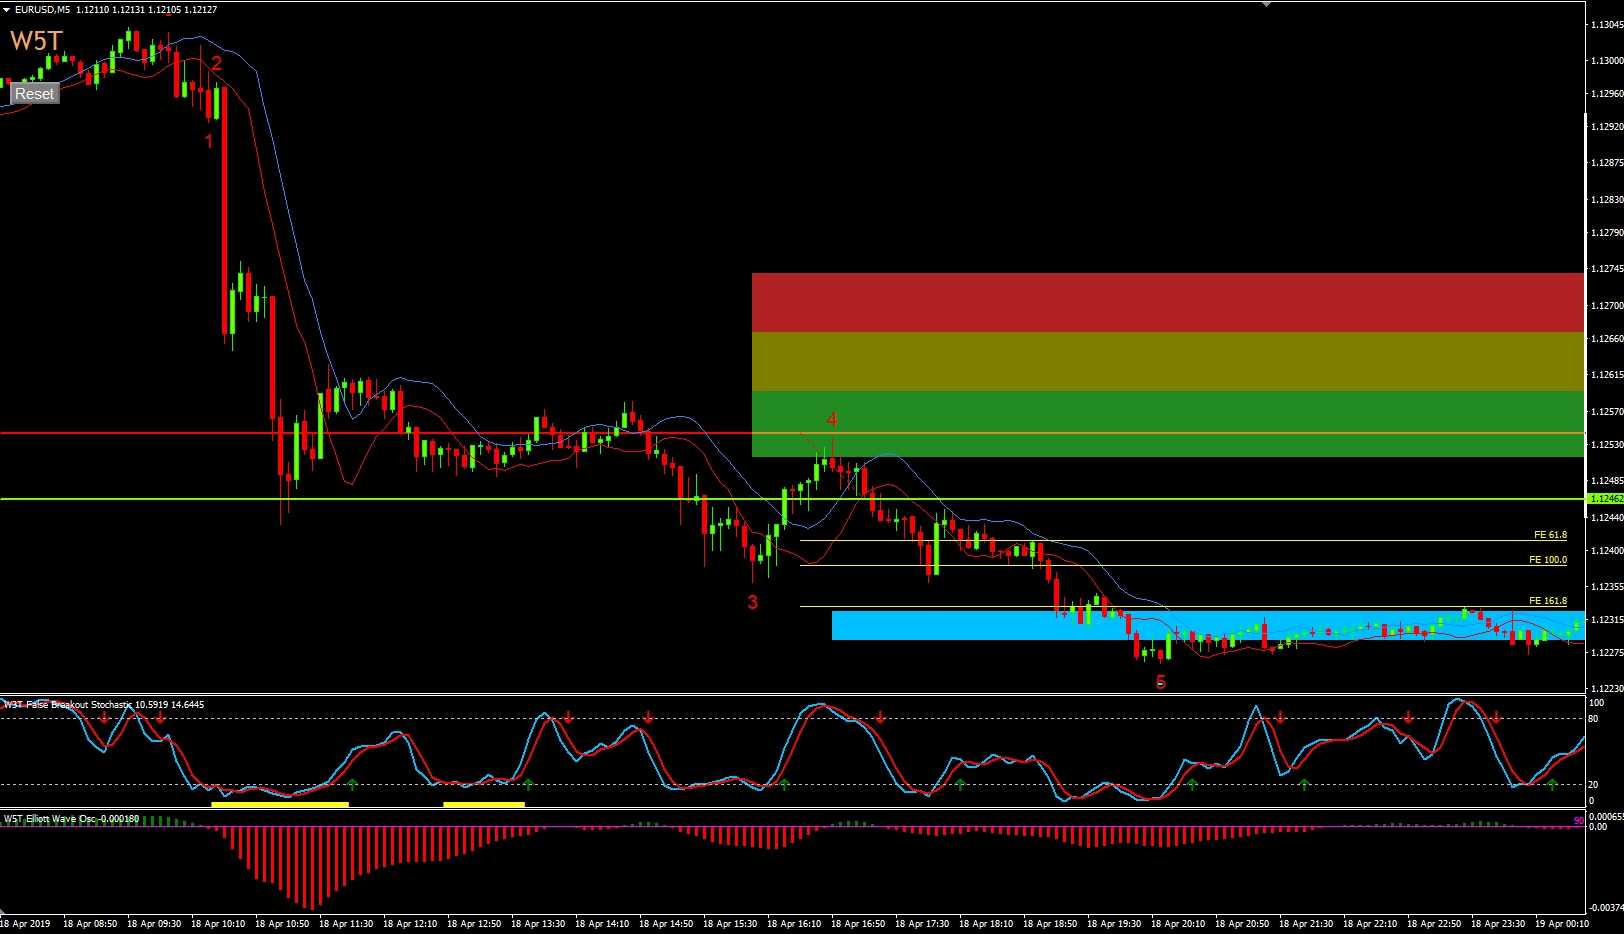
The second observation helps us determine a target price for the 5th Wave. Along with previous support and resistance levels from one time frame up to what we are trading.
The Wave 1 and Wave 5 tend to be the same size. and further more the 5th wave is usually between 120% and 140% of the height of the 4th wave. We have automated this for you and print our automated 5th wave target zones as part of our Elliott Wave Indicator Suite. As can be seen in blue in the screen shot below of our Elliott Wave Indicator Suite for the MT4 trading platform.
Observation 3
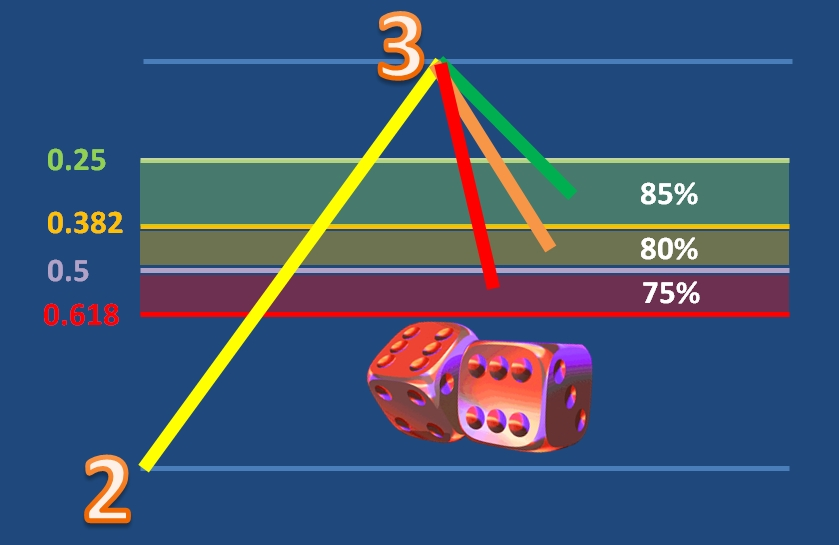
This is the first of two Elliott Wave Observations that are included in our indicator suite as they are measurable. We have provided automatic Wave 4 Pull Back Zones that measure the depth of the Wave. This is compared to that of the whole length of the 3rd Wave. These are represented by Green, Amber and Red zones on your chart and are dynamic. They adjust until the Wave 3 high has been found and the 4th Wave Pull Back is underway. If the Wave 4 Pullback finds support/resistance in the Green Zone then there is an 85% probability that a new Wave 5 high will occur. For the Amber zone it is 80% and then the Red Zone is 75%. These zones use Fibonacci retracements between the Wave 2 and Wave 3 extremes.
If the Wave 4 pull back goes beyond the Red Zone then the probability is too low for a Wave 5 will occur. Therefore a real possibility that the trend will fail. You are really rolling dice if you look for a trade out of these zones.
Observation 4
5/35 Oscillator
This Elliott Wave Theory observation is also included in our indicator suite and overall strategy. It is a further back-up to the previous observation. It also measures the performance of the Wave 4. Therefore determining a high probability that a Wave 5 is going to occur.
The 5/35 Oscillator is a histogram representation of the gap between a 5 and 35 moving average. The Wave 4 should pullback between 90% and 140% of the highest point on the Oscillator during the Wave 2. To see this in action and how to measure this, please watch the video below.
In Conclusion
So these are the main Elliott Wave Theory Rules and Observations that make up our Specially designed Indicator Suite for the MT4 trading platform. There are more parts to the overall strategy which are explained in full during the 4 hour training bootcamp which accompanies the purchase of our Indicator Suite.
To Check out the information for each trading platform that our Elliott Wave Indicator Suite is designed for, please Click >>>HERE<<<
Download Today and Join 1000's of users around the world that use our Elliott Wave Indicator suite on 7 Different Trading Platforms including MT4, Thinkorswim, NinjaTrader, Multicharts, TradeStation, TradingView and MotiveWave


