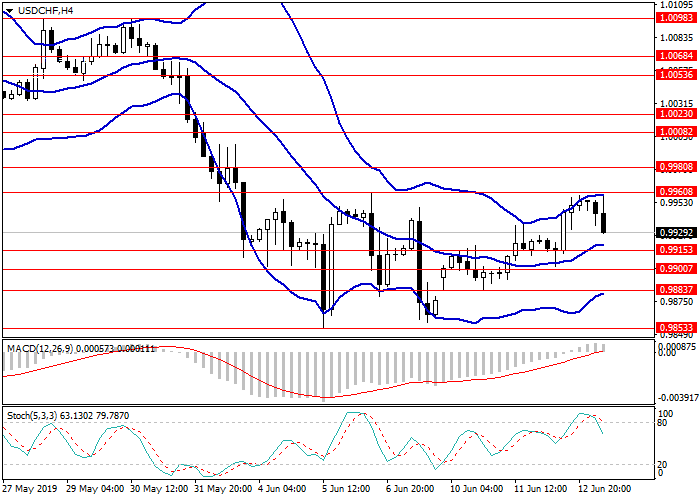
On the 4-hour chart, the instrument trades within a sideways channel formed by the boundaries of Bollinger bands, the indicator cloud narrows. The MACD histogram is in the positive area, the signal line crosses the zero line upwards, forming a signal to open long positions. Stochastic is preparing to leave the overbought zone, forming a signal to open sell orders.
Trading tips
Short positions can be opened from the current level with the target at 0.9885 and stop loss 0.9960.
Long positions can be opened from the level of 0.9980 with the target at 1.0050. Stop loss is 0.9950.
Implementation period: 1–3 days.


