

Major US stock indexes began a new month and a quarter with a fall. On Monday, US and world stock indices are falling amid escalation of international trade conflicts, weak economic data on China, deterioration of the political situation in the German government.
The strongest decline is - of banks shares, automobile companies and firms connected with the raw materials sphere.
Trump is considering the possibility of imposing duties on imports of cars in the US at a rate of 20%, including from Europe.
The presidential administration is currently studying this issue.
Discussing the course of the negotiations on the revision of the terms of the North American Free Trade Agreement with Mexico and Canada (NAFTA), Trump said that "if they do not like it, I will tax the cars they bring to the US, and that's serious".
Since mid-June, the main US stock indexes are declining. And today is not an exception. Pessimism of investors and negative dynamics of stock indices prevail.
*)An advanced fundamental analysis is available on the Tifia Forex Broker website at tifia.com/analytics
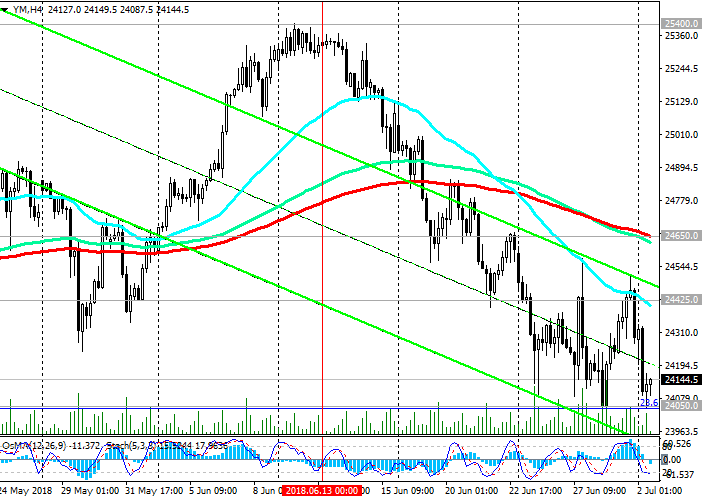
Support and resistance levels
With the opening of the trading day on Monday, the DJIA is down, coming close to a strong support level of 24050.0 (EMA200 on the daily chart and Fibonacci level of 23.6% of the correction to the growth from the level of 15650.0 in the wave that began in January 2016. The maximum of this wave and the Fibonacci level 0 % are near the mark of 26620.0).
The breakdown of the support levels 24050.0, 23800.0 (EMA50 on the weekly chart) will significantly increase the risks of breaking the bullish trend.
Indicators OsMA and Stochastics on the daily, weekly, monthly charts recommend short positions.
The first signal for the resumption of the upward dynamics will be the breakdown of the short-term resistance level 24425.0 (EMA200 on the 1-hour chart).
The breakdown of resistance level 24650.0 (EMA200 on the 4-hour chart) will confirm the resumption of the upward dynamics and bullish trend of DJIA.
The nearest growth target is resistance level 25400.0 (June highs). In the event of a breakdown of the resistance level 25400.0, the DJIA will head towards resistance levels 25750.0, 26620.0 (absolute and annual highs).
Support levels: 24050.0, 23800.0, 23120.0, 22450.0
Resistance levels: 24425.0, 24650.0, 25400.0, 25750.0, 26200.0, 26620.0
Trading Scenarios
Buy Stop 24350.0. Stop-Loss 23950.0. Take-Profit 24425.0, 24650.0, 25400.0, 25750.0, 26200.0, 26620.0
Sell Stop 23950.0. Stop-Loss 24350.0. Take-Profit 23800.0, 23120.0, 22450.0
*) For up-to-date and detailed analytics and news on the forex market visit Tifia Forex Broker website tifia.com


