Wave Analysis of Gold for June 30, 2016
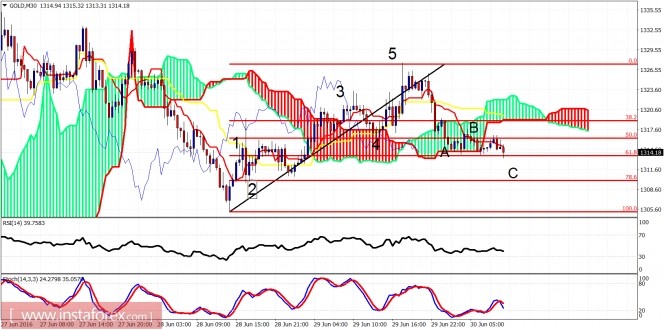
Gold has completed 5 waves up in the short term from $1,305 to $1,328 and also made a corrective pullback towards the 61.8% Fibonacci retracement. This is the first short-term bullish signal after the spike last week, and as long as we hold above $1,305, we can say that the next leg up has started.

Gold is in the final stages of the corrective wave as can be seen on the 30 minute chart above. A break above $1,317 will confirm the correction is most probably over and we should expect a sharp rise towards at least $1,330. Breaking above it will open the way for $1,350-60 at first.

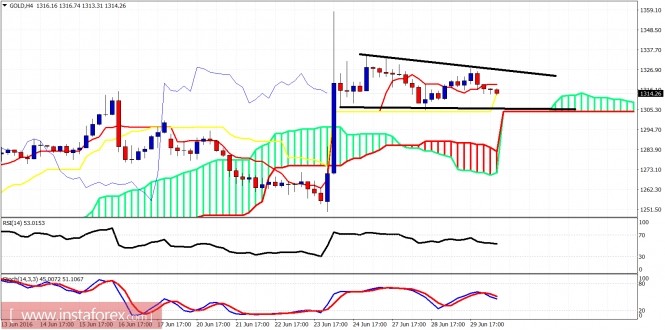
Gold remains above the Kumo on the 4-hour chart and still inside the triangle pattern or consolidation range. A clear break above $1,330 will trigger a bigger upward move. The target remains $1,400 and can be achieved by the end of next week. I remain longer-term bullish and continue to believe that $1,045 is a long-term low.


