Technical Analysis of Gold for April 18, 2016
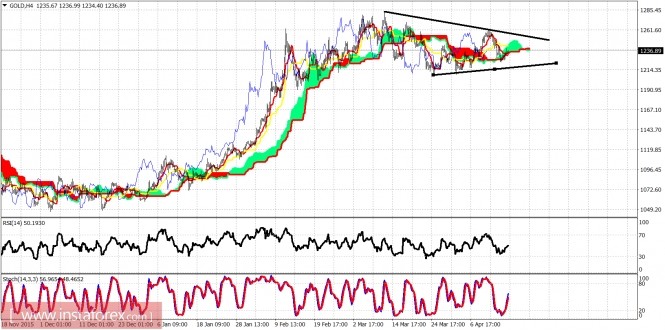
Gold continues to trade sideways inside a triangle formation. The trend is neutral as the price is trapped inside a trading range between $1,260 and $1,215.

Black lines - triangle
Gold is inside the 4-hour chart Kumo (cloud) as bulls try to support prices. Short-term support is at $1,223 and next at $1,215. Resistance is at $1,245 and next at $1,260. Currently I prefer to be neutral as the price can go either way from current levels.

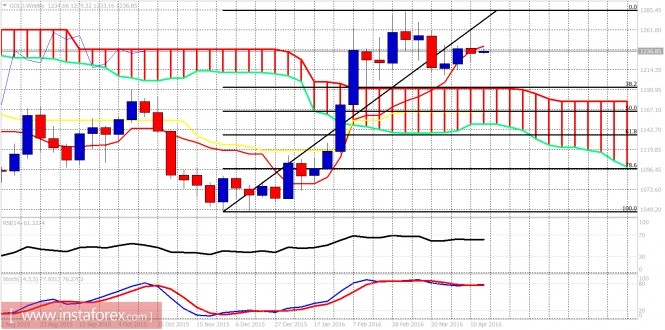
On a weekly basis, the price has started giving some bearish reversal signals. The price closed last week below the tenkan-sen indicator (red line). The second bearish sign is the fact that the stochastic oscillator is turning lower from overbought levels after a bearish divergence where the stochastic did not make a new high as the price did. I continue to expect Gold to move at least towards $1,190 as the most probable scenario.
The material has been provided by InstaForex Company - www.instaforex.com


