Technical Analysis of USDX for April 5, 2016
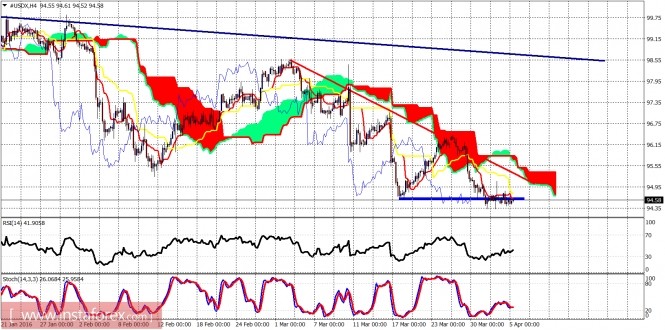
The Dollar index did not make any substantial move yesterday and continues to trade around the support of 94.50. The trend remains bearish in the short and medium term. Bears however should be very cautious and protect their positions with tight stops.

Red line- resistance
Blue area- support
The Dollar index remains below the Kumo (cloud) resistance and is trading sideways since yesterday. Support is at 94.40 while resistance is at 95.50. There are still chances of a bounce towards 95 and then a new low but as long as we are above 94.40 I remain short-term neutral.

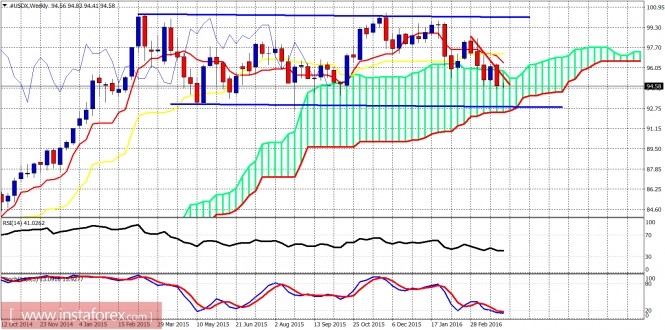
Blue lines - sideways channel
The Dollar index weekly chart shows us that the downward move could extend towards 93 and may not be over yet. Important weekly support is at 93 while important resistance is at 95.50. In the larger context, price continues to move inside the sideways channel.
The material has been provided by InstaForex Company - www.instaforex.com


