
If we want to find the most important tool for the technical analysis of securities we just couldn’t find a better one then moving average. Traders was using it as an earliest tool for finding profitable buying and selling points. Moving average is still used by traders and investors from all hues as a major reference point. All of the variations that are existing are trying to remove the noise created by the daily price fluctuations, but two of them mostly used are the simple moving average (SMA) and exponential moving average (EMA).
Simple Moving Average (SMA)
SMA is the simpliest type of moving average. In the SMA the
arithmetic mean that the past few trading sessions is calculated. Adding
the closing price of the past trading sessions and then dividing the
sum by the number of trading sessions are the ways of doing it. Lets
look at the recent closing price of a Google:
Week 1 (01/26/2015 – 01/30/2015): 536.7, 521.2, 512.4, 513.2, 537.6
Week 2 (02/02/2015 – 02/06/2015) : 532.2, 533.3, 526.1, 529.8 , 533.9
Simple moving average for 5 days will be:
| Trading session | Price | SMA (5) |
| 1 | 536.7 | * |
| 2 | 521.2 | * |
| 3 | 512.4 | * |
| 4 | 513.2 | * |
| 5 | 537.6 | (536.7+ 521.2+ 512.4,+513.2+ 537.6)/5= 524.2, Day 1 to 5 |
| 6 | 532.2 | (521.2+ 512.4,+513.2+ 537.6+532.2)/5= 523.3, Day 2 to 6 |
| 7 | 533.3 | 527.5, Day 3 to 7 |
| 8 | 526.1 | 530.1, Day 4 to 8 |
| 9 | 529.8 | 533.4, Day 5 to 9 |
| 10 | 533.9 | 532.6, Day 6 to 10 |
A moving average is commonly used with time series data to smooth out short-term fluctuations and highlight longer-term trends or cycles or more precisely smoothing out any price fluctuations by averaging out the peaks and lows. So viewed simplistically it can be regarded as smoothing the data. The threshold between short-term and long-term depends on the application, and the parameters of the moving average will be set accordingly. Longer period moving average would be smoother than a shorter period moving average. It is often used in technical analysis of financial data, like stock prices, returns or trading volumes. Many traders are using two or more moving averages in conjunction to find trends and momentum within the market.
Let’s look at how this tool is used to find an ideal entry/exit point:

Here we can see that when SMA (20) crosses SMA (50) line from belowa, aclear signal is given that the overall trend is bullish and points towards an upward momentum in the stock. The traders can use this crossover point as an ideal time to invest in the stock. From the above we can see that this momentum continued for a good period of time. It gave good returns till the next crossover which signaled that the bullish trend is over. SMA (50) and SMA (200) are taken into consideration to find the ideal crossover points and look at the overall trends if we are looking for a longer term investing horizon.
Exponential Moving Average
This is the type also known as an exponentially weighted moving average (EWMA). It is the type of infinite impulse response filter that applies weighting factors which decrease exponentially. Exponential moving average (EMA) provides an average where the recent prices are given more weightage.We can look at the difference between SMA and EMA in the following image:
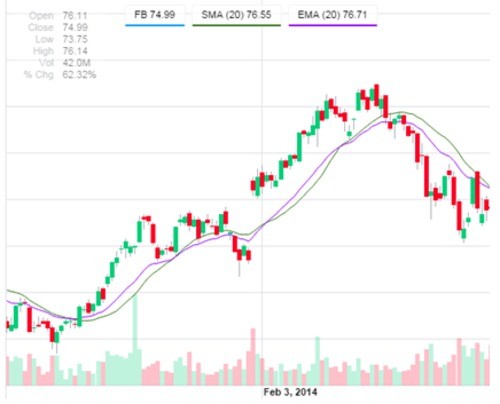
Fig 2: EMA follows the price changes more closely than SMA as it gives greater weightage to recent price movements. In the image the purple (EMA, 20) line is able to follow the price more closely than green (SMA, 20) line both during uptrends and downtrends. For short term trends a smaller length of period is used. Generally a shorter trading horizon uses (EMA, 12) and (EMA, 26) to find ideal trading points. 12 and 26 refer to the average counted over 12 days and 26 days.
Similarly a longer investment horizon looks at longer lengths of period. A commonly used method is to find crossover of (EMA, 50) and (EMA, 200). When (EMA, 50) line is ABOVE the (EMA, 200) it signals a bullish trend whereas if it is BELOW the (EMA, 200) line it signals a bearish trend.
Drawbacks Of Moving Average
Unfortunately, moving averages are not perfect tools for establishing trends and they present many subtle, but significant, risks to investors. We know now that there are some pitfalls with it. The biggest one is that they have a lag when showing the price changes. This reduces their benefit as an early indicator. The key disadvantages of moving averages are:
1. As the MA draw trends from past information they don’t take into account changes that may affect a security’s future performance, such as new competitors, higher or lower demand for products in the industry and changes in the managerial structure of the company.
2. Moving averages don’t work for all companies, especially for those in very volatile industries or those that are heavily influenced by current events.
3. General trend can change significantly depending on the time period used. Investors must be careful which time frame they choose, to make sure the trend is clear and relevant. Most of the traders use other tools like MACD and Bollinger Bands to get an early indication of reversal in price movements. SMA and EMA charts are then used to confirm the predictions made by other tools.
Conclusion
It is not advised using it in isolation. For any tool to be effective you must first understand its function, when to use it and when not to use it. Moving averages have stood the test of time and have also spawned a vast array of other important tools like MACD. Understanding these tools can be a key determinant in making good entry and exit decisions in the stock market. Moving averages may be a tool best used in conjunction with others. Personal experience will be the ultimate indicator.


