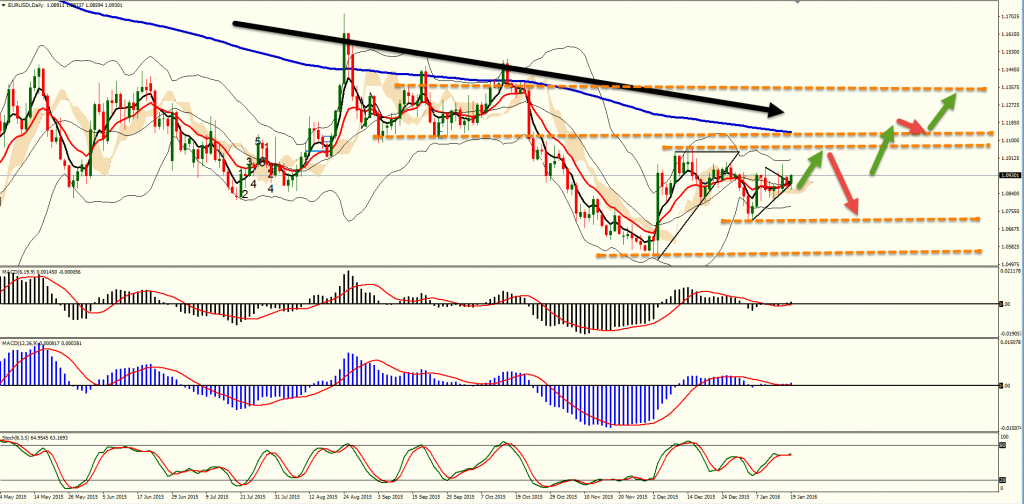
On this eurusd daily chart you might note that price today broke out of our triangle.
Price tested the cloud but printed during the day a bullish candle.
This means that the cloud acted as support which held and attracted more buyers.
MACD crossed the zero line upwards which would be another bullish signal.
If you take this bullish trade then you might place your stop loss below the cloud and as a first target you might choose the area of 1.10200.
BEST OF PIPS