EURGBP Elliottwave Techincal Analysis: Downside from current level or from 7480?

Talking Points:
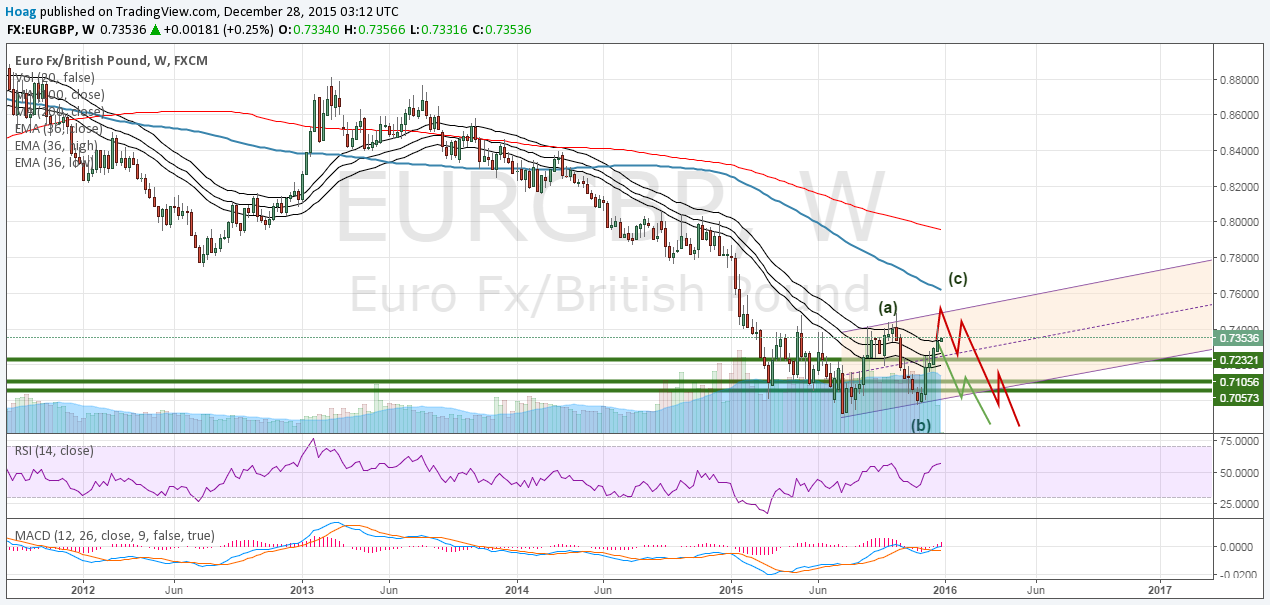
- EURGBP Technical Strategy: Long term Bearish
- Elliottwave Count: Either current price is wave 2 in lower time frame or flat correction playing on daily and weekly chart.
EURGBP is playing a nice elliottwave structure. With keep in mind current price action, there can be two possible wave structure can be identified.
Scenario 1: On which, we are already part of reversal process and this can be wave 2 in hourly chart and retraced 78.6% fibbo level. If this scenario played, we can see down trend resume from current price. if not, scenario 2 will be more likely to happen.
Scenario 2: On which, we possibly see flat correction on daily and weekly chart. And can see one more upside towards 7480 to 7500 area before reversal hinted. For this scenario to be played, we need to wait more days to see structured developed.
How I can trade this pair?
Well, to trade this pair, we need to wait for more days to decide. Either we can put sell stop or keep our hands on gun and eye open to trigger trade button. To know, when and how to trade, join us on "Trade Signal with Analysis" plan on which we are publishing every trade with their reasoning behind every action we performed.
To get an instant trade update or analysis, join us our service or you can avail 14 days free trial by clicking here
Contact and follow HoagTrading on Twitter: @HoagTrading