
EUR/USD Intra-Day Technical Analysis - bearish ranging or bearish breakdown
26 November 2015, 08:00

0
1 546
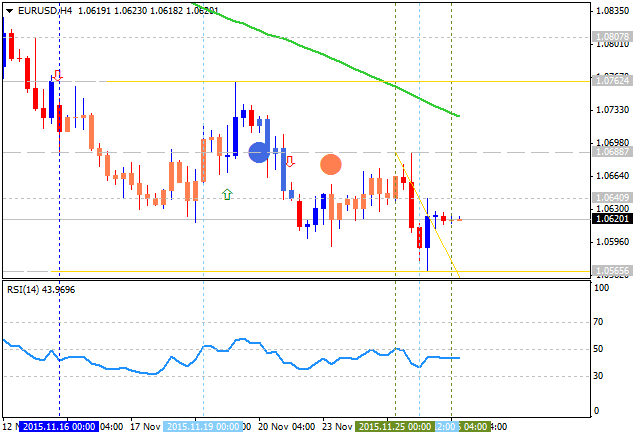
H4 price is located below SMA with period 100 (100-SMA) and SMA with the period 200 (200-SMA) within the following key support resistance levels:
- 1.0762 key reversal resistance level located on the border between the primary bearish and the primary bullish on intra-day chart, and
- 1.0565 support level located on the bearish area of the chart.
RSI indicator is estimating the ranging bearish market condition to be continuing.
- If the price will break 1.0762 resistance level so the reversal of the intra-day price movement from the primary bearish to the primary bullish condition will be started up to 1.0807 as the next nearest target.
- if price will break 1.0565 support so the bearish trend will be continuing.
- if not so the price will be ranging within the levels.
| Resistance | Support |
|---|---|
| 1.0762 | 1.0565 |
| 1.0807 | N/A |
- Recommendation to go long: watch close price to break 1.0762 resistance level for possible buy trade
- Recommendation to go short: watch close price to break 1.0565 support level for possible sell trade
- Trading Summary: ranging
SUMMARY : ranging


