
It is recommended to read the page Currency score explained and Models in practice for a better understanding of the article. This article will provide my analysis on the 8 major currencies based on the technical analysis charts using the MACD and Ichimoku indicator on 4 time frames, the monthly, weekly, daily and 4 hours. The result of the technical analysis is the 2 screenshots in this article showing the Currency Score and the Currency Score Difference.
___________________________________________
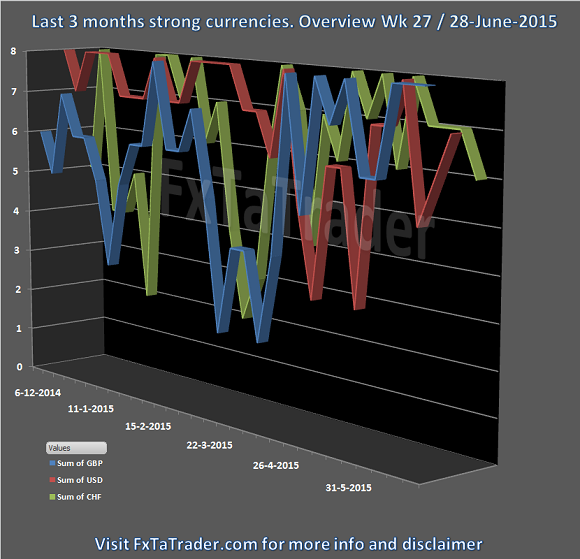
Last 3 months currency classification
The last 3 months currency classification from a longer term perspective are provided for reference purposes. There are some changes and the new classification is provided here with the necessary charts which can be found at the bottom of this article. The currencies are classified for the coming weeks as follows:
- Strong: GBP / USD / CHF. The preferred range is from 6 to 8.
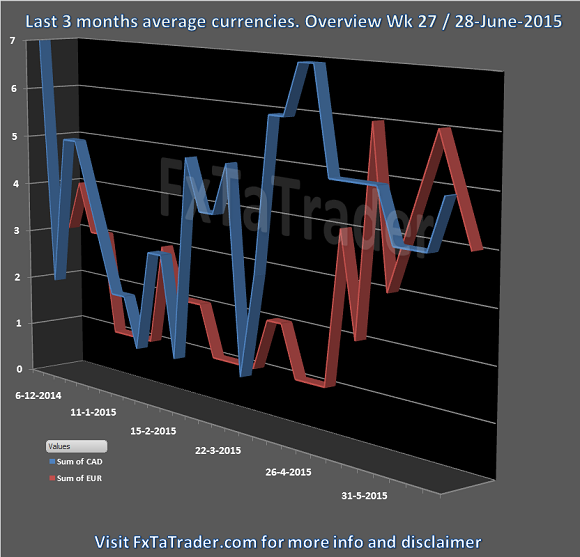
- Average: CAD / EUR. The preferred range is from 4 to 5.
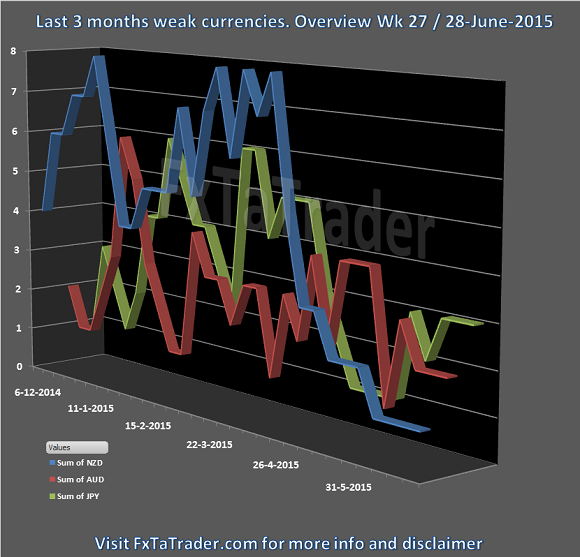
- Weak: NZD / AUD / JPY. The preferred range is from 1 to 3.
___________________________________________
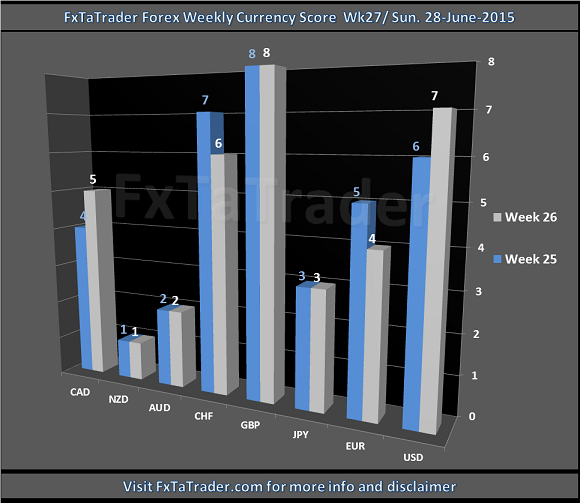
Currency Score
For analyzing the best pairs to trade this classification is the first issue. When looking at the most recent score that is used for the coming period we can see in the screenshot that there are no deviations. All the currencies are postioned nicely in their range.
The conclusion is:
- All currencies are at the right level when looking at the last 3 months currency classification.
- All the pairs that we may look at are all most
probably trending.
___________________________________________
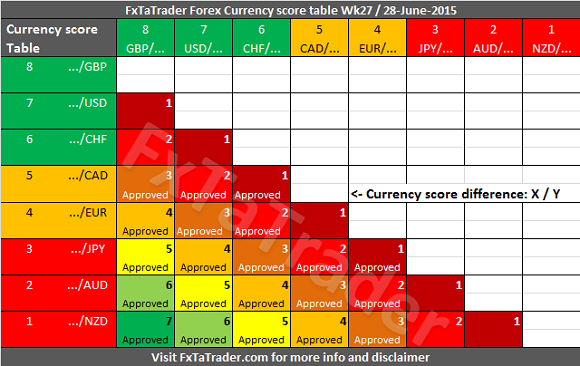
Currency
Score difference
According to the Ranking and Rating list already published this weekend the following pair combinations look interesting:
- GBP/NZD with the USD/JPY
- GBP/AUD with the NZD/CHF
- NZD/USD with the GBP/JPY
- AUD/USD with the GBP/JPY
___________________________________________
- The GBP/NZD is in an uptrend and and outside the Bollinger Band. It seems best to wait for a pullback to see the pair back again within the Bollinger Band.
- The USD/JPY is in a uptrend and within the Bollinger Band.
- The GBP/AUD is in an uptrend and outside the Bollinger Band. It seems best to wait for a pullback to see the pair back again within the Bollinger Band.
- The NZD/CHF is in a downtrend and at the Bollinger Band.
- The NZD/USD is in a downtrend and just outside the Bollinger Band. Most probably it will be inside when trading starts again.
- The GBP/JPY is in an uptrend and within the Bollinger Band.
- The AUD/USD is in a downtrend and within the Bollinger Band.
When trading according to the FxTaTrader Strategy some rules are in place. For more information see the page on my blog FxTaTrader Strategy. Depending on the opportunities that may come up the decision to trade a currency may become more obvious at that moment.
___________________________________________
Last 3 months currency classification charts
Here below are the charts providing the Currency classifications for reference purposes. There are three charts showing resp. the stronger, average and weaker currencies.
___________________________________________
___________________________________________


