
USDCAD Price Action Analysis - ranging within the levels with trying to break 38.2% Fibo level at 1.2268 for the correction to be started
22 June 2015, 06:11

0
665
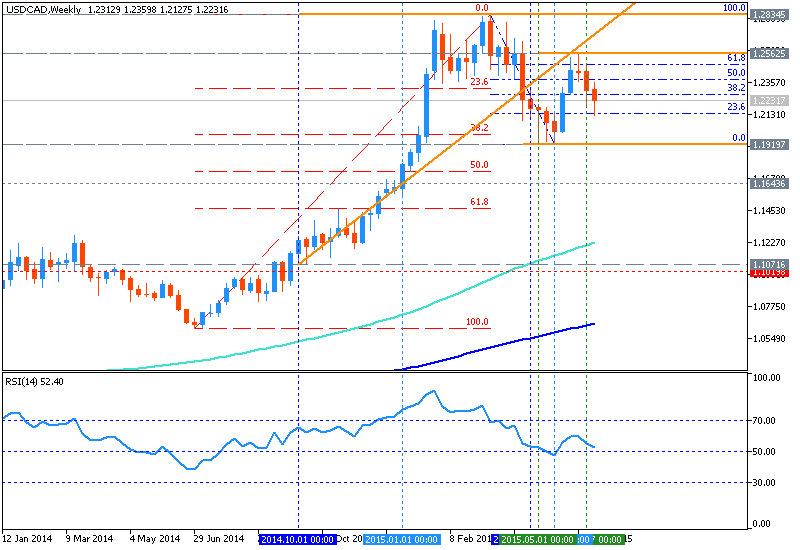
W1 price is located above 200 period SMA
and 100 period SMA for the primary bullish market condition. The price is ranging between 1.2562 resistance and 1.1919 support level with trying to break 38.2% Fibo level at 1.2268 from above to below.
If weekly price will break 38.2% Fibo level together with 1.1919 support level so we may see the secondary correction within the primary bullish condition, otherwise the price will be ranging within familiar levels.
- price is ranging between ranging between 1.2562 and 1.1919 level;
- 200 period SMA
and 100 period SMA are located far below weekly price which is indicating the primary bullish market condition;
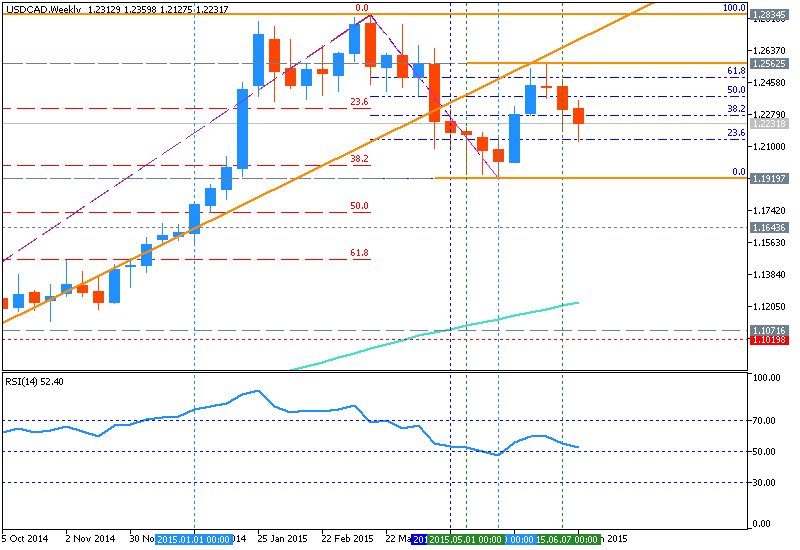
- The
price is breaking 38.2% Fibo level at 1.2268 from above to below and came close to 1.1919 as the next support level to be broken for the correction to be started;
- if weekly price will break 38.2% Fibo level together with 1.1919 support level so we may see the secondary correction within the primary bullish condition, otherwise the price will be ranging within familiar levels.
Trend:
- H4 - ranging bearish
- D1 - ranging bullish
- W1 - ranging bullish
- MN1 - reversal from ranging bearish to the bullish condition


