Technical Analysis - USDTRY ranging bullish on 2.6479 key resistance level for most of the timeframes
11 April 2015, 15:33
0
540
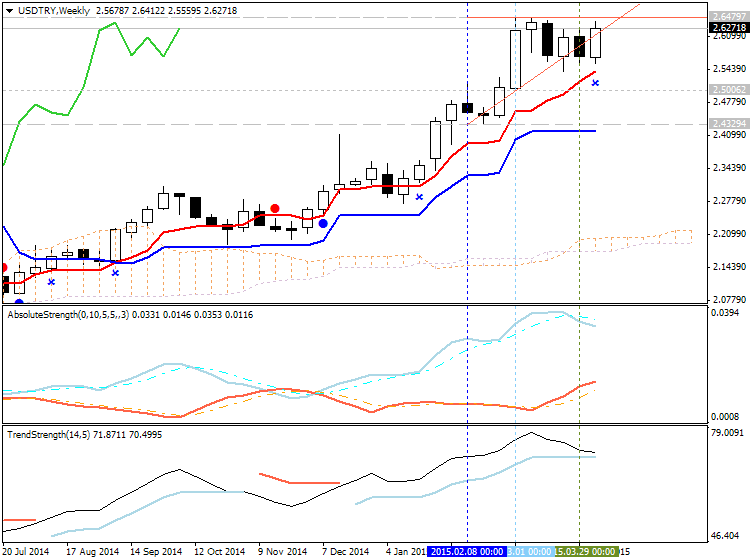
- Tenkan-sen line is located above Kijun-sen line of Ichimoku indicator with 2.6479 resistance level on W1 timeframe with good signal for uptrend on open W1 bar.
- Kumo (Ichimoku cloud) is located far below the market price which is indicating the strong primary bullish market condition for this timeframe.
- AbsoluteStrength indicator is showing the ranging, and and TrendStrength indicators is on uptrend as a primary direction - this is indicating the possible ranging market condition within the primary bullish for example.
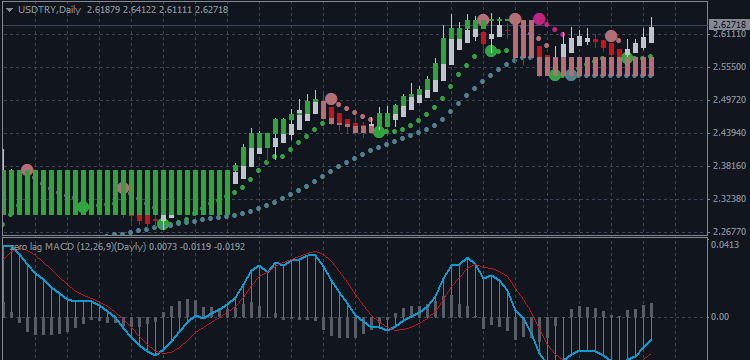
- D1 price is on breakout for breaking the 2.6227 resistance on open D1 bar. If this resistance level is broken on close daily candle so the bullish breakout will be continuing up to the forming the new resistance as a new high to be broken on the future.
- MN1 timeframe price - 1.6479 is resistance level for this chart as well. So, it is really important: if the price is breaking this level so we can expect for the price to have good breakout

Trend:
- H4 - bullish with the ranging started
- D1 - bullish breakout
- W1 - ranging bullish
- MN1 - bullish breakout


