

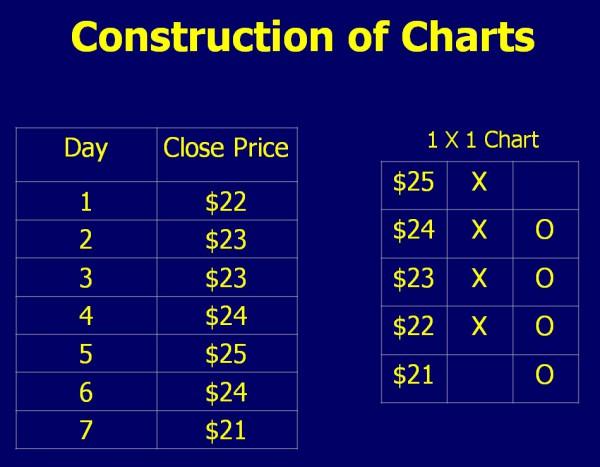
To create the trading chart, you will use an “X” to note when prices rise by a certain amount and an “O” when they decline by an amount. You only put X’s or O’s in a column.
- If you need O’s due to a reversal in price, you would start a new column.
- You do not put X’s and O’s in the same column.
The larger reversal size will filter out many small corrections that might have otherwise scared traders out of positions.
You can take a simple buy signal when a column of X’s rises above the previous column of X’s. You could stay long until a sell signal has been generated. The simple sell signal comes when a column of O’s breaks below a previous column of O’s.

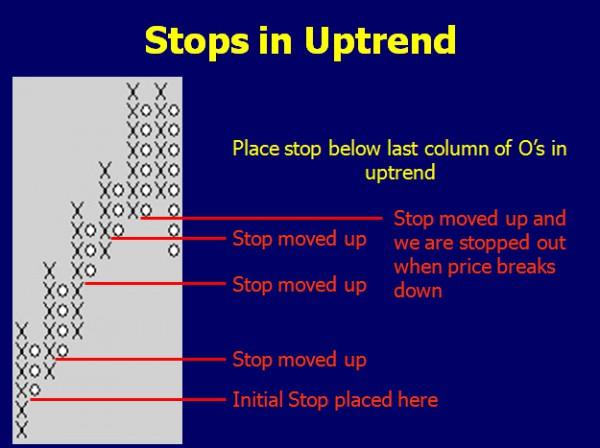
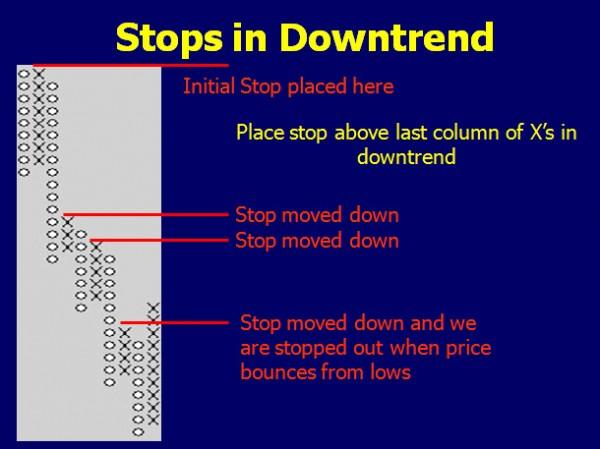
When we trade, we should know at least three things about the position before we take it. We need to know our entry, the stop, and the target we hope to achieve. A point and figure chart can offer all of that to us. We can place our stops for longs just under the last column of O’s. As long as there is no reversal that breaks that low, we stay in the trade.
If we are using a larger reversal size, 1×3, 20×3 or so, we can still use a horizontal projection. In this case, we would multiply the horizontal box count by the box size and the reversal size to determine the projection length.


")