

“I Love the '80s” was a BBC television miniseries that examined the world through the lens of 1980s pop culture. (VH1’s riff on the show can be found here).
I bring up the '80s because of a wonderful chart from Ron Griess who runs The Chart Store.
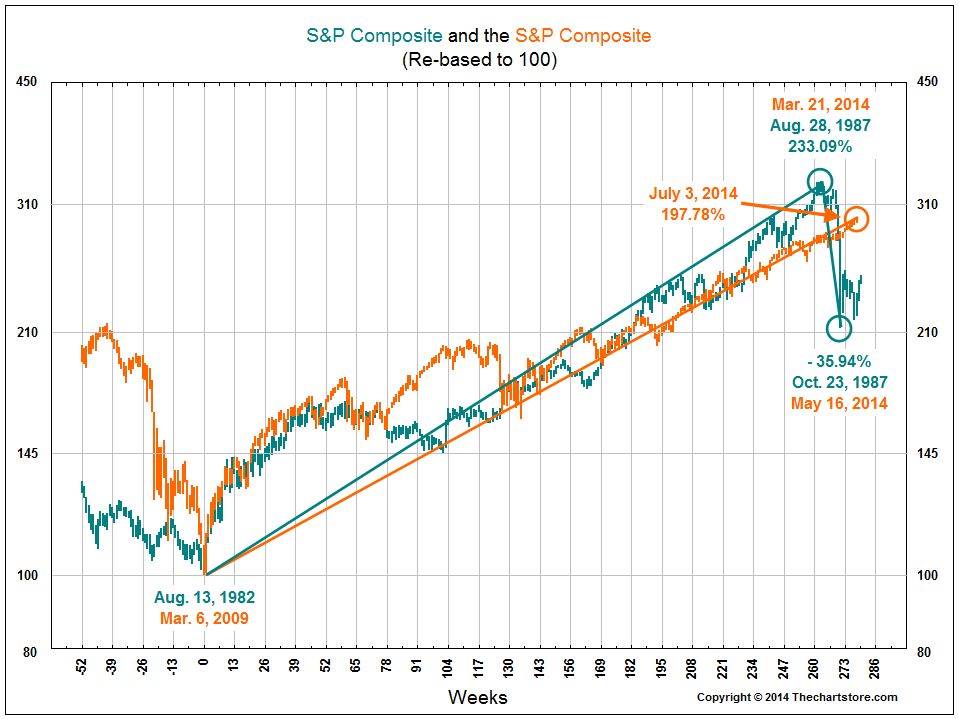
The chart compares today's Standard & Poor's 500 Index (from its recent low in March 2009) with the same index from the early 1980s (from its low in August 1982).
The responses from people I showed the chart to have been fascinating. Some immediately pointed out that the market in the 1980s began strong but ran straight into Black Monday -- Oct. 19, 1987. On that day the market dropped 22.6 percent -- the worst single-day crash in U.S. market history. Others noted that the 1980s was the beginning of a secular bull market that spanned 18 years and rose more than 1,000 percent.
In this morning’s column, I explained how having an investment posture affects the way you perceive the world. The reactions to this chart validate the psychological concept of confirmation bias.
Griess wrote on his site:
“The chart lines up the S&P 500 bottom in 2009 using the date of the lowest low as the base at 100. Analog charts are interesting, but we would caution that history does not always repeat exactly.”
If the market made it that easy, what would we do with the rest of our day?


