

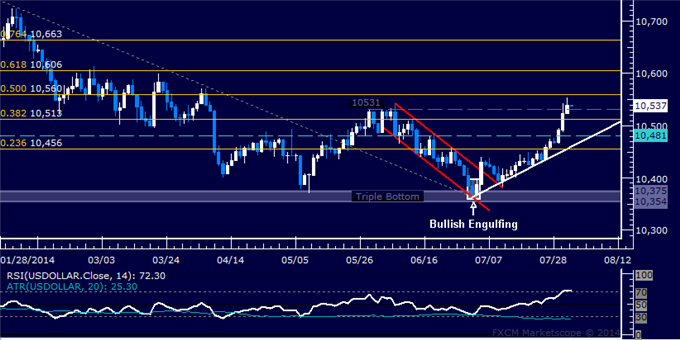
Prices broke above another layer of resistance after reversing
upward as expected having put in Bullish Engulfing candle pattern.
Near-term resistance is at 10560, which is 50% Fibonacci retracement. Daily
close above that exposes 61.8% level at 10606. Alternatively, a turn
back below the May 28 high at 10531 opens clears the way for test of 38.2% Fib at 10513.


")