Price Pattern Analysis for US Dollar, Gold, S&P 500 and Grude Oil - Crude Oil Range-Bound Above $58, Gold Selloff Resumes

US DOLLAR TECHNICAL ANALYSIS
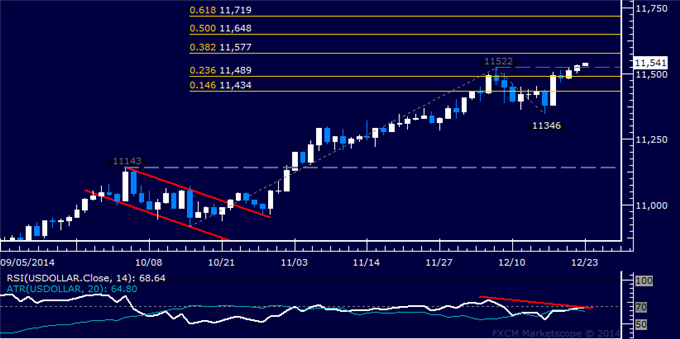
Prices edged past December’s swing
top to establish a new five-year high. Near-term resistance is at
11577, the 38.2% Fibonacci expansion, with a break above that on a daily
closing basis exposing the 50% level at 11648. Negative RSI divergence
warns of ebbing upside momentum and hints a downturn may be brewing
ahead.
S&P 500 TECHNICAL ANALYSIS
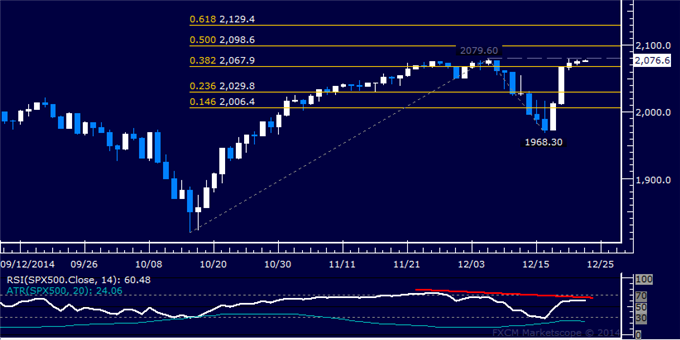
Prices are testing resistance in
the 2067.90-79.60 area marked by the 38.2% Fibonacci expansion and the
December 5 high. A daily close above this barrier exposes the 50% level
at 2098.60. Negative RSI divergence warns of ebbing upside momentum
however and hints a reversal lower may be in the cards.
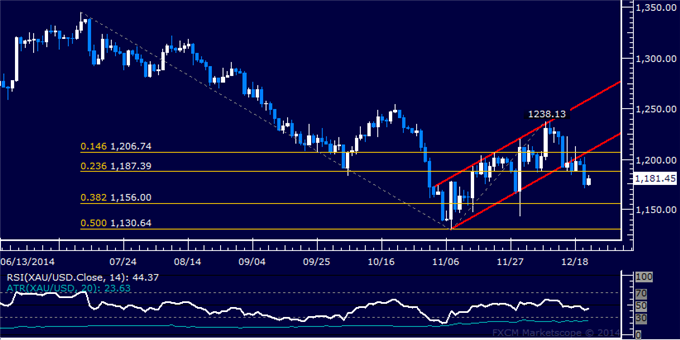
GOLD TECHNICAL ANALYSIS
Prices resumed downward momentum, with
sellers now aiming to challenge the 38.2% Fibonacci expansion at
1156.00. A break below this boundary on a daily closing basis exposes
the 50% level at 1130.64.
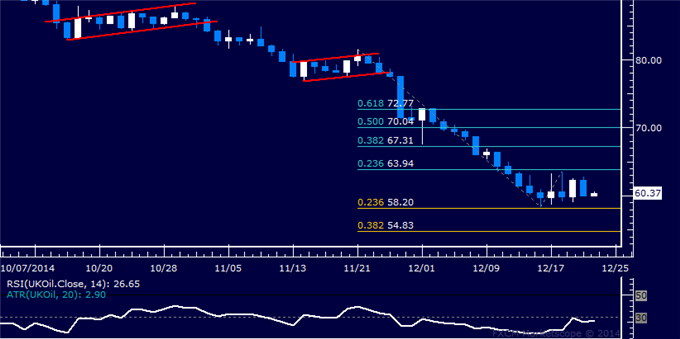
CRUDE OIL TECHNICAL ANALYSIS
Prices are in consolidation mode
above the $58.00/barrel figure. A break below the 23.6% Fibonacci
expansion at 58.20 exposes the 38.2% level at 54.83.