

An increase in volatility can cause price to breakout
Camarilla Pivots can be designated for planning order entries
Traders can use 1x extension of the trading range for profit targets
While price may spend the majority of its time reversing between lines of support and resistance, there will also be periods of volatility when price breaks out. A price breakout simply refers to the price of a traded asset moving through a pre-designated area of either support or resistance. Savvy traders can then prepare to look for these opportunities by finding these values on their graph. To help plan for a breakout, we will continue our review of camarilla pivots.
AUDNZD Breakout
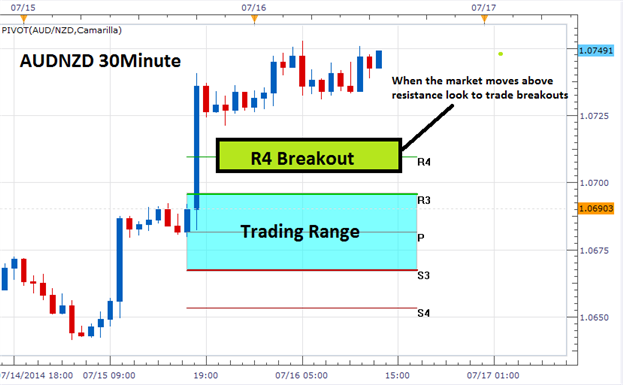
Support, Resistance, & Breakouts
We will first need to identify existing points of support and
resistance. When added Camarilla pivot points to the graph, these pivots
will allow traders to spot a breakout using the R4 and S4 lines now
available on their graph. Now traders can consider a series of options
for trading.
The easiest way to trade breakouts is through the use of a series of
order entries. Entry orders set above resistance will be waiting to buy
the market in the event price moves to higher highs.
Conversely, orders to sell below the S4 line of support will be
triggered upon the market moving to lower lows. Traders that would like
more confirmation may also consider waiting for a candle close, then
triggering a market order. The key is to get into the market on a new
surge in price, which generally transpires along with an economic
announcement.
AUDNZD Entry and Target
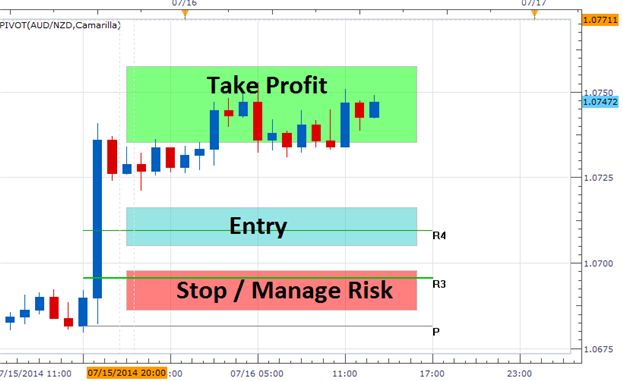
Risk & Profit Targets
As with any trading strategy, traders should spend as much time planning
their exits as they do their entry orders. Through the use of Camarilla
Pivots, traders again can develop a very systematic methodology for
exiting the market. Since the market is breaking out, risk can be
managed by placing stop orders inside of the designated trading range.
The rationale behind this is that if market conditions change, traders
should close their positions and look for other opportunities.
Once a stop is found, traders can then set a profit target. Since our
pivot points are calculated using a fraction of the previous day’s
trading range, we can again use the designated values for profit
targets. Traders can look for a minimum of 1 times the denoted range,
which in the example of the AUDNZD above would be 28 pips. This would
equate to a 1:2 risk reward ratio when used with a standardized stop.


