

0
812
In this video, we will cover finding an edge to trade.
Traders will look for set-ups, patterns, or situations that give them 'an edge' for predicting what price will do next. In other words, the trader is looking for something that helps improve their ability or chances. An edge is not something that always happens. It is something that is slightly more likely to happen which hopefully helps push the odds of success into the trader's favor.
Let's look at some common edge examples that traders will use.
Perhaps the trader will trade using fundamentals. Maybe there is an economic report or earnings release coming out and the trader will trade the release. Often the trader will look at the consensus estimate for the report or release, and go long if they feel the results of the report or release will beat estimates, or they will go short if they feel the report or release will fall short of estimates.
Perhaps the trader will use market sentiment. Because the majority of traders lose money in markets, often sentiment is used as a contrarian indicator, and the trader will look to go the opposite direction of the majority.
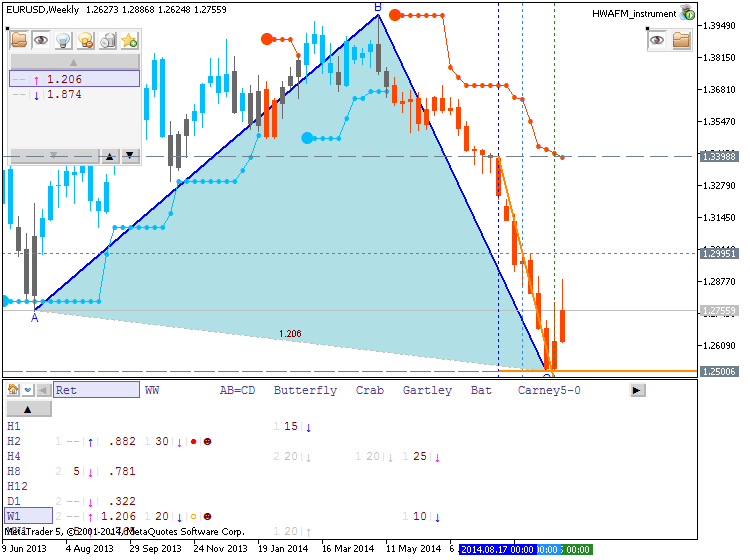
Perhaps the trader will use markets cycles, Fibonacci numbers, Gann, or pivot points to try and get an edge of where price will go.
Or perhaps the trader will simply follow the trend: They trade the trend, wait for a small pull back, and enter when price hits support/resistance, or a fib number.
The trader will look for a chart pattern to from such as a double top, or a head and head and shoulders,
or candlestick pattern to form and will trade the confirmation of the pattern.
As price approaches major support or resistance, the trader may trade a break through. Usually it takes a lot of momentum for price to break through a major level of support or resistance, so the trader will enter on a break through hoping the momentum will continue and perhaps even pick up steam.
Or, as price approaches major support or resistance, the trader may trade a reversal. Perhaps as price approaches a major level of support or resistance, it will begin to lose steam, bounce off and reverse. The trader will trade the reversal.
Likewise, if price is in a range or channel, the trade will look to trade a breakout of the range or channel, or as price approaches the wall of the range or channel, they will trade a reversal. Trading a reversal in a horizontal range is one of the more simple patterns to trade. Let's build a trading plan to trade horizontal ranges.
A horizontal range occurs when price is forming a range between 2 levels of support and resistance, much like a ball bouncing up and down between a ceiling and a floor. Horizontal ranges are often found after price makes a large move either up or down. After Price makes a major move up or down, it tends to pause and go into a horizontal range for a bit while it 'figures out' if it will keep going in that direction, or reverse back the other way.
To develop this plan, we will first look for price to form a horizontal range after making a large move up or down. We will look at entering at the wall of the range, which we will cover in more detail in the video on entering a trade.
Traders will look for set-ups, patterns, or situations that give them 'an edge' for predicting what price will do next. In other words, the trader is looking for something that helps improve their ability or chances. An edge is not something that always happens. It is something that is slightly more likely to happen which hopefully helps push the odds of success into the trader's favor.
Let's look at some common edge examples that traders will use.
Perhaps the trader will trade using fundamentals. Maybe there is an economic report or earnings release coming out and the trader will trade the release. Often the trader will look at the consensus estimate for the report or release, and go long if they feel the results of the report or release will beat estimates, or they will go short if they feel the report or release will fall short of estimates.
Perhaps the trader will use market sentiment. Because the majority of traders lose money in markets, often sentiment is used as a contrarian indicator, and the trader will look to go the opposite direction of the majority.
Perhaps the trader will use markets cycles, Fibonacci numbers, Gann, or pivot points to try and get an edge of where price will go.
Or perhaps the trader will simply follow the trend: They trade the trend, wait for a small pull back, and enter when price hits support/resistance, or a fib number.
The trader will look for a chart pattern to from such as a double top, or a head and head and shoulders,
or candlestick pattern to form and will trade the confirmation of the pattern.
As price approaches major support or resistance, the trader may trade a break through. Usually it takes a lot of momentum for price to break through a major level of support or resistance, so the trader will enter on a break through hoping the momentum will continue and perhaps even pick up steam.
Or, as price approaches major support or resistance, the trader may trade a reversal. Perhaps as price approaches a major level of support or resistance, it will begin to lose steam, bounce off and reverse. The trader will trade the reversal.
Likewise, if price is in a range or channel, the trade will look to trade a breakout of the range or channel, or as price approaches the wall of the range or channel, they will trade a reversal. Trading a reversal in a horizontal range is one of the more simple patterns to trade. Let's build a trading plan to trade horizontal ranges.
A horizontal range occurs when price is forming a range between 2 levels of support and resistance, much like a ball bouncing up and down between a ceiling and a floor. Horizontal ranges are often found after price makes a large move either up or down. After Price makes a major move up or down, it tends to pause and go into a horizontal range for a bit while it 'figures out' if it will keep going in that direction, or reverse back the other way.
To develop this plan, we will first look for price to form a horizontal range after making a large move up or down. We will look at entering at the wall of the range, which we will cover in more detail in the video on entering a trade.
So those are some basic edges traders will use when trading. An edge can really be anything that can be traded including cycles, correlations, fundamental edges and technical edges. However, do not be overly fixed on the edge as it is just one part of a complete trading plan that includes trade management and money management, both of which are more important than the trader's edge. I hope that you enjoyed this video- thanks for watching.


