
About Sippoo Supply Demand Input Parameters
VAP Settings
”Sippoo Supply Demand” utilizes Volume at Price (VAP), and therefore, specific settings related to VAP need to be configured.

・Period(MN1,W1,D1,H12,H8,H6,H4,H3,H2,H1)
Specify the timeframe format for aggregating VAP.
・Sample Bar(M1,M5,M15)
Choose the timeframe of the bars used in VAP aggregation. This setting is configured for each period and may impact processing performance.
・Volume Type (Not Use, Tick Volume, Real Volume)
Select the type of volume used in VAP aggregation.
・Bin Size(1-100 Points)
Specify the bin width for the histogram. Note that there is an internal limit on the maximum number of bins in the histogram (within 1000), and if exceeded, it will be automatically adjusted.
These settings are related to VAP configuration.
Size Settings
・Smoothing Factor(1.0-10.0)
Coefficient for smoothing the histogram. This is a critical factor for adjusting the scale.
・Minimum Cluster Width(1-9999 Points)
Prevents lines from being too close together by setting the minimum width of clusters. Note that this setting is for the width of the clusters. Cluster boundaries are displayed as dots. This setting is configured for each period.
・Overlap Judgment Size(1-9999 Points)
This sets the threshold for determining when two lines are considered too close and should be considered overlapping. If overlapping is detected, a line will be drawn at the position of the cluster boundary.
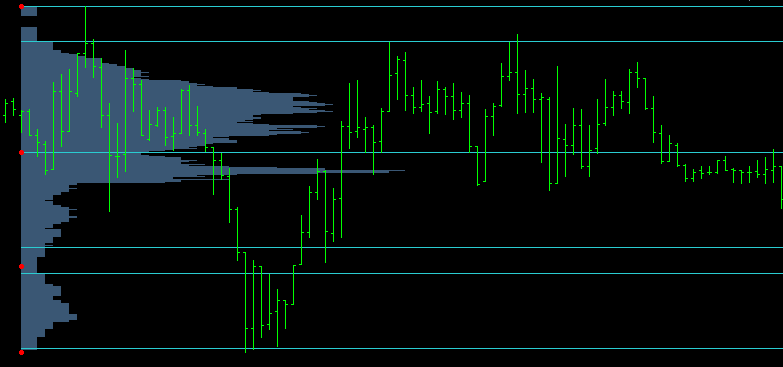
Fixed line, Active line
When a period is set, lines for two periods will be displayed. For example, setting the period to D1 will show lines for yesterday (already completed) and today (currently being created). These are referred to as Fixed Line for yesterday's line and Active Line for today's line.

・Update Bar (M5-D1)
While a Fixed Line remains fixed and confirmed, an Active Line changes over time. To control this, there is a setting for updating bars. For example, if the update bar is set to H4, it will be configured to update only when the H4 bar is confirmed.
・Minimal Sample Count
Horizontal lines drawn shortly after a date change may lack reliability due to a low sample count. By setting the minimum sample count, you can control whether to display lines if the specified sample count is not reached. This is a crucial setting when using alerts.
Easy Setup Panel
The easy setup panel allows direct adjustment of the following settings on the chart.
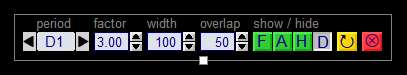
- Period (MN1-H1): Specify the range period.
- Smoothing Factor (1.0-10.0): Specify the smoothing factor for histograms.
- Minimal Cluster Width (in pts): Specify the minimum cluster size.
- Overlap Judgment Size (in pts): Specify the criterion value for judging overlapping lines.
- Show Lines (fixed): Specifies whether to show or hide fixed lines.
- Show Lines (active): Show/hide active lines.
- Show Histogram: Show/hide the histogram.
- Show Dots: Show/hide dots.
- Update Button: Reflects the setting.
- Clear Button: Clear the setting.
Other Settings
In addition to these, there are other display-related settings and alert configurations.


