

When to Use Fundamental vs Technical Analysis?
Technical analysis is a more reliable method than fundamental analysis for forecasting future price movements, at least when applied to trend / momentum. Correctly anticipating changes in central bank policies may be more powerful but is extremely hard to execute. For example, anyone with minimal chart-reading experience can look at a price chart and tell whether the price has gone up over the past six months, and whether it has done so strongly or weakly. Getting a good handle on the interplay between economic data points and central bank policies as data over or undershoots is much more complicated. Unfortunately, many beginner traders are taught that mastering fundamental analysis is important, but the only simple relationship between price and fundamental data is in interest rates, and that has historically been less predictive in Forex than price momentum in major currencies such as the US Dollar or the Euro.
Having said that, fundamental analysis can function as an excellent filter. This means that technical analysis in the form of momentum indicators can give you an effective system for trade entries, but you could risk more on trades where your own fundamental analysis agrees with the technical analysis.
There are an infinite number of technical analysis approaches and combinations one can use to trade and beginning with a good foundation of technical tools helps each trader to find their personal trading style. My style of technical analysis incorporates an amalgamation of price action and one or two momentum indicators at most applied to higher time frames in the major Forex currency pairs, but each trader will find what best suits the, after a period of research and practical experimentation. My use of technical analysis first and fundamental analysis second is just one way to use the two methods. There is no ‘one size fits all’ or fixed rules around what to use when, but it is important to understand the purpose and assumptions behind methods you wish to employ.
How to Learn Fundamental Analysis?
The best way to learn how to use fundamental analysis in Forex is as follows:
-
Make an excel spreadsheet of key high impact economic and central bank data for each currency you are interested in analyzing. Important data points to include are:
-
Interest rate
-
Inflation rate
-
GDP
-
Central bank forecasts
-
Any other data points considered highly important for the currency
-
-
Each data point should have room for two entries: consensus forecast and actual data. You should be able to get both from good economic calendars for a reasonably long historical period.
-
Add additional inputs: the price change of the currency’s basket following the data release over the next month, and whether the data overperformed or underperformed the forecast.
-
Run through the spreadsheet and see if you noticed any patterns. For example, when data points come in higher than forecasted, did the price rise?
-
Read as much high-quality commentary on the major Forex economic data releases as you can and compare the general tone of these to how the price is performing.
As I said earlier, technical analysis is much simpler and easier to learn than fundamental analysis, which is often more of an art than a science. The key thing to watch for, is a surprise, especially when central banks are forced to suddenly change approach. These can trigger the start of major trend changes, giving you the confidence to follow technical indicators in the same direction and to try to hold on for the long term. When done successfully, this can bring big profits.
How to Trade with Technical and Fundamental Analysis
Below are some examples of all three possible solo or combination approaches showing how to trade with either technical or fundamental analysis methods or a combination of both.
Technical Analysis Trading Example
The price chart below shows a modest yet effective technical analysis setup using trendlines, an SMA, and the RSI. Joining highs and lows using standout trendlines is a great way of gauging the overall trend of the market as well as possible reversals (marked in blue).
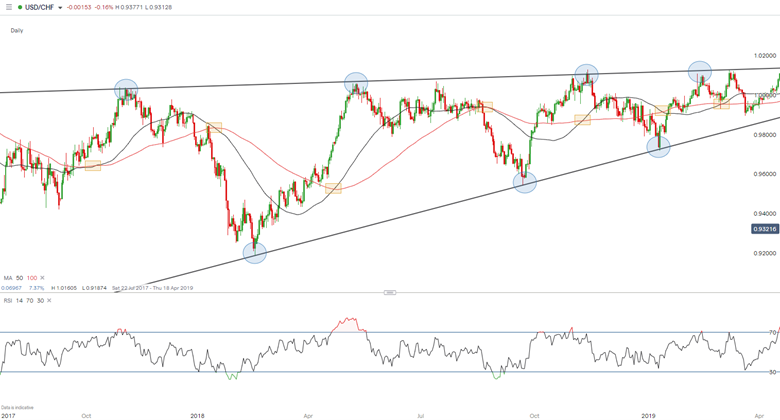
The RSI is used to indicate any extreme bias in the market and is marked by the green and red areas on the RSI, respectively. Finally, I have included two SMAs (50 and 100). The SMA is a multipurpose indicator that can help evaluate or support trend direction – if prices are above the SMAs, a bullish bias is favored, and vice versa. Furthermore, moving average crossovers (marked in yellow) can be indicative of an upcoming upside or downside move – bullish when the shorter-term SMA (red) crosses above the longer-term SMA (black) with the same logic being applied the other way. Key psychological levels and areas of confluence play an important role in trader psychology, this has been eliminated from this example but should not be overlooked in real world application.
Fundamental Analysis Trading Example
A major fundamental driver of Forex rates is the interest rate differential between two currencies. The monthly NZD/USD chart below shows that when the Reserve Bank of New Zealand began easing its monetary policy in April 2015, while the US Federal Reserve began increasing rates shortly after, indicated the beginning of a downwards price movement in the NZD/USD currency pair.
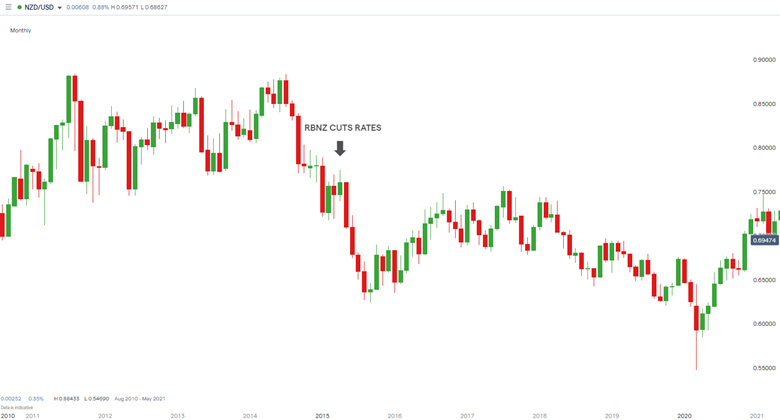
The result was a depreciation of the NZD against the USD as the attractiveness of a higher interest rate pulled investors into US assets, increasing the demand for USD. This simple example of interest rate dynamics shows the influence of economic theory on the Forex market and how following interest rate differentials can help traders gain an edge.
Fundamental With Technical Analysis Trading Example
My final example shows how a trader can utilize both technical and fundamental analysis at the same time. This is a more complex scenario but getting the timing of a trade right both fundamentally and technically has proven to be highly effective in my experience. The weekly Dollar Index (DXY) price chart below involves price action, trendlines, candlestick patterns, indicators, and fundamental knowledge.
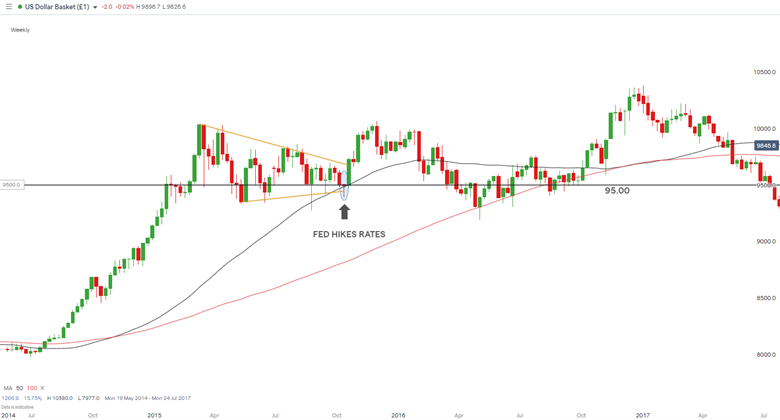
During the period leading up to the Fed rate hike labeled on the chart, markets had some inclination of a coming rate hike by following prior statements made by Fed officials and money market pricing - most of this information can be accessed via major financial media outlets and trading websites free of charge.
The weekly candlestick at the time of the Fed’s announcement hovered around the key 95.00 psychological round number along with the bull pennant’s (marked in yellow) lower support line and the 50-day SMA. These technical indicators were beginning to hint at a forthcoming bullish price movement. From this point, a trader could wait for the weekly candlestick to close (shaded in blue) which provided an additional bullish signal by the lower long wick of the candlestick.
My trading experience tells me that the greater the number of factors/signs in favor of a particular direction, the better the chances of a successful trade. Should the trade move against the intended direction, using price action data such as swing lows and highs can help with placing suitable stop losses to minimize risk and maximize the potential reward to risk ratio, which is very important for overall trading profitability.
Advantages and Disadvantages of Fundamental vs Technical Analysis
|
| Advantages | Disadvantages |
| Technical |
|
|
| Fundamental |
|
|
Final Thoughts
Both technical and fundamental analysis have their own pros and cons but if I were asked to advise any trader on which one to focus on first, it would be technical analysis. This is because although fundamental analysis can be a powerful tool, it is very challenging and usually needs the application of technical analysis for timing of trade entries and exits. It is possible to make money with technical analysis alone, but very hard to do so with fundamental analysis alone.
Some feel that technical analysis has been discredited, or at least has a bad name. This is because too many traders go crazy using indicators and get overly concerned with which indicators and settings they use. Simple methods of determining the direction and strength of momentum on multiple time frames are likely to be all the technical analysis you need, maybe in addition to a good method of determining likely support and resistance levels.
Fundamental analysis can be a great trade filter. For example, if your trading strategy has a definition of a breakout, you might determine what fundamental factors are telling you and only take those breakout trades which are supported by your fundamental analysis. Another method is to risk more on those trades than the breakouts which are not supported by your fundamental analysis.
The most effective elements of fundamental analysis in trading Forex are central bank monetary policies, especially interest rates, and inflation. As the Forex market is driven mainly by the US Dollar which accounts for something like 80% of Forex globally, FOMC meetings are usually the most important fundamental event in the Forex calendar to watch.
Dailyforex site materials used
Automate your trading with our Robots and Utilities
Scalper ICE CUBE MT4 - https://www.mql5.com/en/market/product/77108
Scalper ICE CUBE MT5 - https://www.mql5.com/en/market/product/77697
EA Long Term MT4 https://www.mql5.com/en/market/product/92865
EA Long Term Mt5 https://www.mql5.com/en/market/product/92877
Utility ⚒
EasyTradePad MT4 - https://www.mql5.com/en/market/product/72256
EasyTradePad MT5 - https://www.mql5.com/en/market/product/72454
Risk manager MT4 - https://www.mql5.com/en/market/product/72214
Risk manager MT5 - https://www.mql5.com/en/market/product/72414
Indicators 📈
3 in 1 Indicator iPump MT4 - https://www.mql5.com/en/market/product/72257
3 in 1 Indicator iPump MT5 - https://www.mql5.com/en/market/product/72442
Power Reserve MT4- https://www.mql5.com/en/market/product/72392
Power Reserve MT5 - https://www.mql5.com/en/market/product/72410


