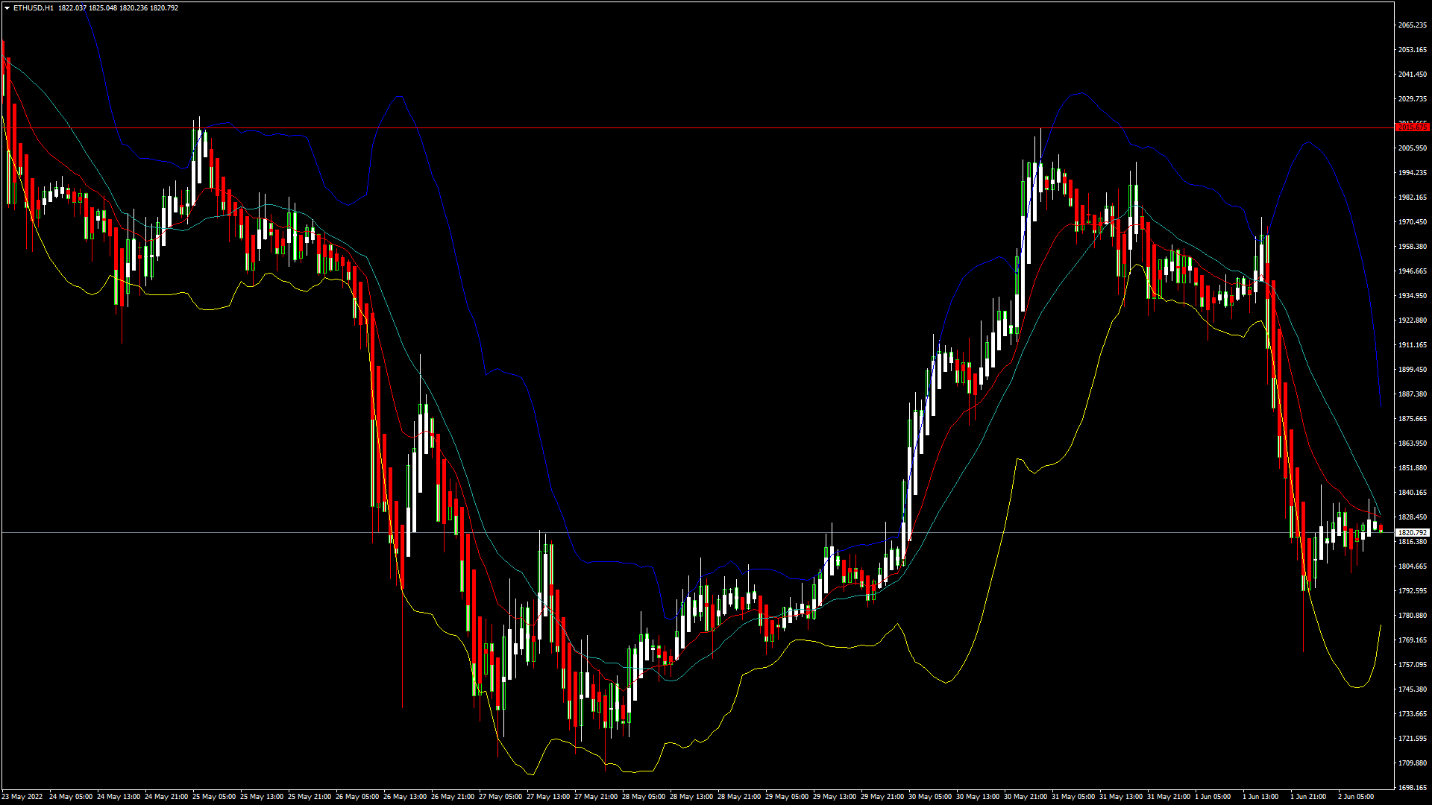
ETHUSD: Bearish Engulfing Pattern Below $2015
Ethereum was unable to sustain its bullish momentum last week and after touching a high of 2011 on 31st May started to decline heavily against the US Dollar.
We can see a strong bearish momentum this week and this is putting downwards pressure on the prices of Ethereum below the 1850 handle in the European Trading session today.
We can see the formation of a Major bearish trend line today on the hourly chart and the pair is poised to decline further given the weak investor sentiments.
The prices touched an Intraday Low of $1794 in the Asian trading session and an Intraday High of $1843 in the European Trading session today.
We can clearly see a Bearish Engulfing Pattern Below the $2015 handle which is a Bearish pattern and signifies the end of a Bullish phase and the start of a Bearish phase in the markets.
ETH is now trading just above its Pivot levels of 1817 and is moving into a Strong bearish channel. The price of ETHUSD is now testing its Classic support levels of 1767 and Fibonacci support levels of 1805 after which the path towards 1700 will get cleared.
Relative Strength Index is at 40 indicating a WEAK market and the continuation of the decline after the consolidation phase gets over....More info: blog FXOpen