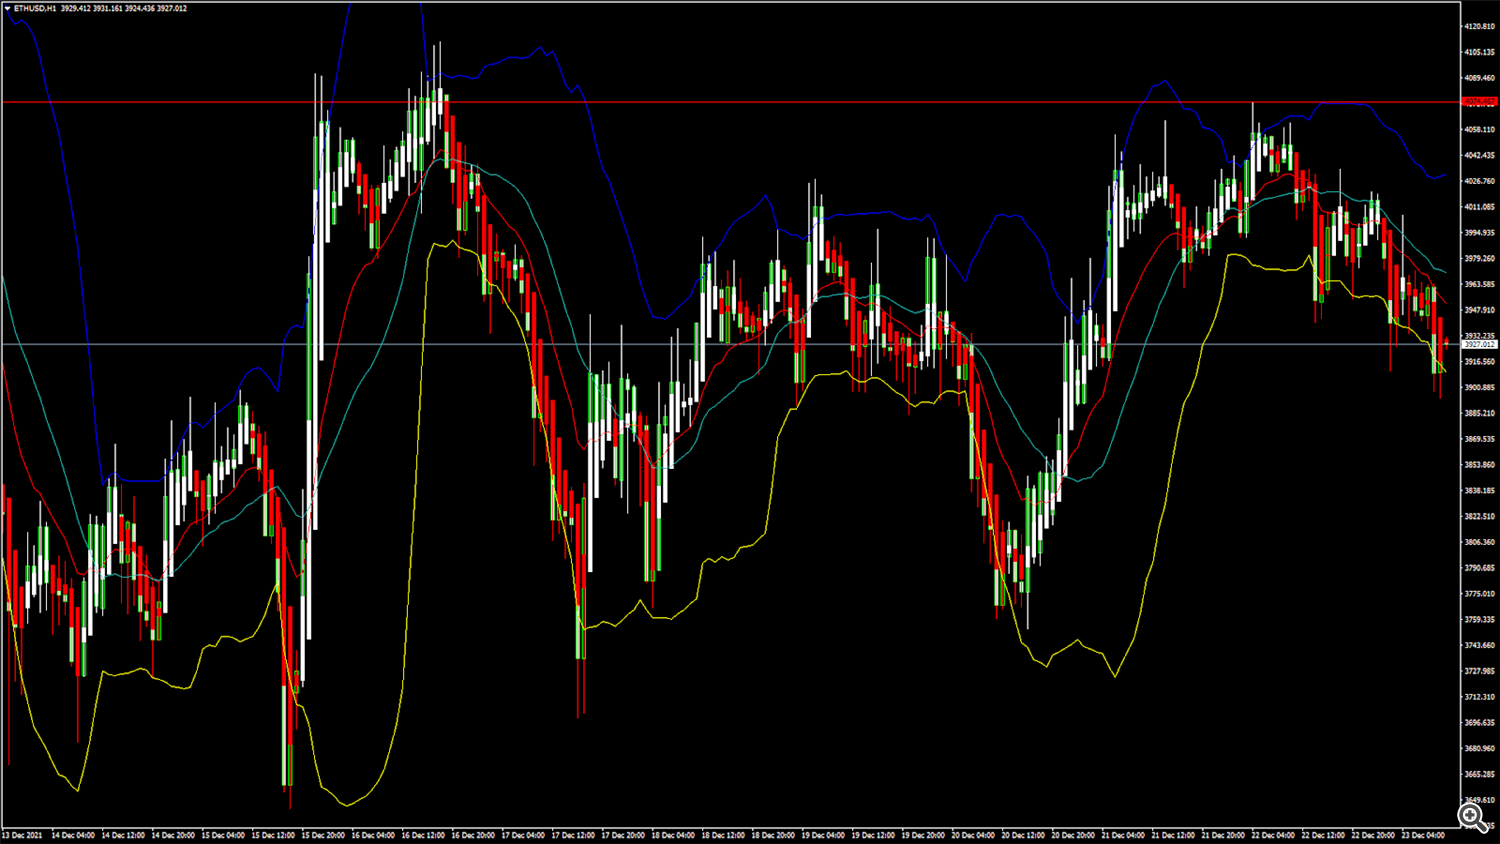
ETHUSD: Head and Shoulders Pattern Below $4,000
Ethereum was unable to sustain its bullish momentum and started its decline below the $4,000 handle in the Asian trading session today.
ETHUSD touched an intraday low of $3,894; the selling pressure continues in the European trading session. We can clearly see a head-and-shoulders pattern below the $4,000 handle which signifies that the prices will break out into a bearish downtrend.
ETH is now trading just below its pivot level of $3,926 and is moving in a bearish descending channel. The price of ETHUSD is about to break its classic support level of $3,890 and its Fibonacci support level of $3,903, after which the path towards $3,800 will get cleared.
All the major technical indicators are giving a STRONG SELL signal.
ETH is now trading below both its 100 hourly and 200 hourly simple moving averages.
- Ethereum trend reversal is seen below the $4,000 mark
- Short-term range appears to be bearish for ETHUSD
- All the moving averages are giving a STRONG SELL signal
- The average true range is indicating LESSER market volatility
Ether Bearish Trend Below $4,000 Confirmed... ..More info: blog FXOpen


