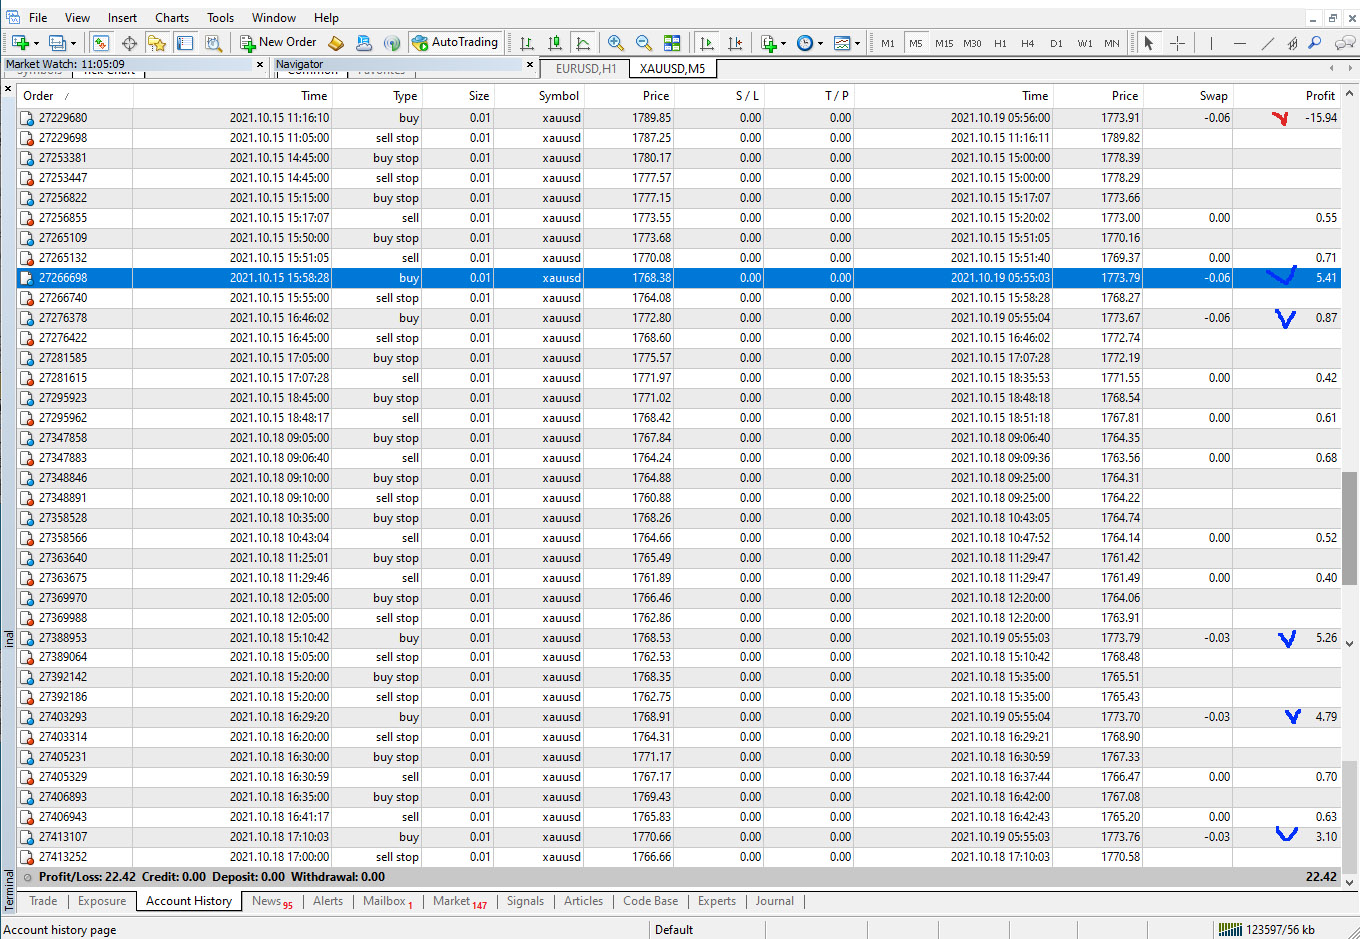
I bring to your attention the results of the forward testing of the Price Trap Full EA in the period from 10/15/2021 to 10/19/2021. Here you can clearly see what happens when the advisor falls into a drawdown.
So, on 10/15/2021, an unsuccessful Buy order was taken at the level of 1789.75. The price went down sharply and 10/18/2021 at the moment dropped to 1760.34.
During this time, the advisor formed a grid of five orders inside the corridor 1768.38 - 1772.80, and fixed to arrive nine times on Sell orders.
The screenshot shows the Account History tab.
0.55 + 0.71 + 0.42 + 0.61 + 0.68 + 0.52 + 0.40 + 0.70 + 0.63 = 5.22
What happened on 10/19/2021 when the price was between 1773.70 and 1773.79?
The EA closed the unsuccessful order with a loss of 15.94, but took profit on five orders of the grid.
In the screenshot, profitable grid orders are marked with blue check marks.
5.41 + 0.87 + 5.26. + 4.79 + 3.10 = 19.43
We calculate: 19.43 - 15.94. It turns out that the profit is 3.49.
Do not forget that there were successful sell orders from 10/15/2021 to 10/19/2021.
In general, we get 3.49 + 5.22 = 8.71.
Please note: there was a buy order at the level of 1789.75, the price fell to 1760.34, but as a result, a profit was made.
You ask: "where is the guarantee that the grid orders will not fail as well?"
My answer is: "Only charlatans can guarantee something on the stock exchange."
Nevertheless, there are objective results of testing the algorithm on history, starting from 2010.
You can make sure that the algorithm denser the grid only when there are clear signs of a reversal.
There is no guarantee, but it is logical to assume that the nature of price changes will remain the same.


![[+96% Profit in 10 Months] 100% Automated NAS100 Strategy 'ACRON Supply Demand EA' [+96% Profit in 10 Months] 100% Automated NAS100 Strategy 'ACRON Supply Demand EA'](https://c.mql5.com/6/983/splash-preview-765084.png)

