- What is the Universal Alerts Indicator?
- Selecting the Indicator
- Indicator Reading Settings
- Alert Settings
- Customization Options
1. What is the Universal Alerts Indicator?
Have you ever found a really good indicator that gives you perfect entries... but you can't use it well because it doesn't have alerts?
Do you use an indicator that has very subtle or very complex signals and you need to look for 10 seconds to know what it is saying?
This indicator is intended to solve those problems. The Universal Alerts indicator reads values from any other indicator in your charts and alerts you when something happens (the indicator crosses a level, price crosses the indicator...), and displays on the chart when that signal happened, which makes setting up the indicator easier (or backtesting the indicator).
In this blog, we'll go deep into how this indicator can be used. If you have an indicator for which you cannot get the correct alerts with any configuration, leave it in the comments and we will try to create the settings to make it possible.
2. Selecting the Indicator
The first step is finding the indicator in your charts. For that you need two values:
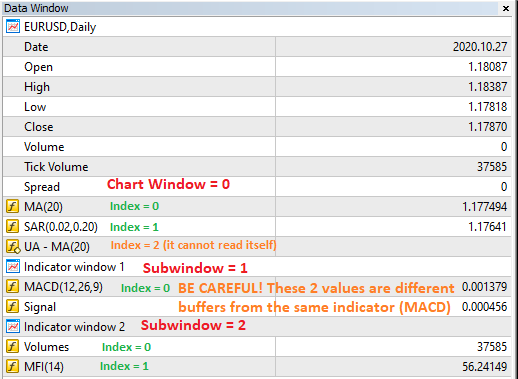
-Indicator Window: Window in which the indicator is placed. 0 is the chart itself; the other subwindows have indexes 1, 2, 3 and so on.
-Indicator Index: Index of the indicator in that window. If the indicator is in a separate window, it's usually 0. Else, it depends on how many indicators there are in your chart/subwindow, and in which order they were added.
The third value, Alerts to Receive, filters which signals that indicator will give you depending on your needs (Buy signals, Sell signals or Both).
You can usually find more information about the windows and indexes in the data window (shortcut Ctrl+D):
The process of knowing the indexes oy your indicators is usually easier in practice. Also, consider how these values may change if you delete any indicator. For example, if Universal Alerts is reading the MFI (W=2, I=1) and you delete the Volumes indicator (which index is lower, 0), then the MFI index would change to 0 (that would not cause an error immediately, until you restart the charts by changing symbol, period or closing MT5).
3. Indicator Reading Settings
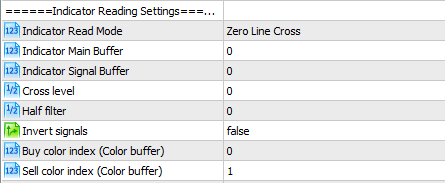
The parameters shown in the upper image are used to configure the indicator. Depending on the reading mode, some of them may not be needed in some cases.
The only parameter that has the same functionality in all cases is "Invert signals", which converts any BUY signal into a sell signal and any SELL signal into a buy signal.
Each Indicator Read Mode and the values needed for each case are described below:
Zero Line Cross: The signals are given when the main buffer crosses up (BUY) or down (SELL) a determined cross level.
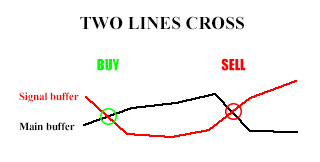
Two Lines Cross: The signals are given when the main buffer and the signal buffer cross (if the main buffer crosses up the signal buffer, it's a BUY signal).
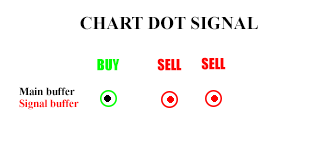
Chart Dot Signal: When the main buffer has a non zero/null value, it's considered a BUY signal. When the signal buffer has a non zero/null value, it's a SELL signal. If both coincide, the main buffer has preference.
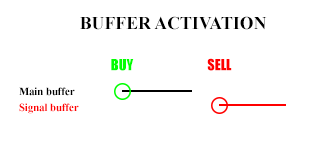
Buffer Activation: Similar to chart dot signal, but only gives a signal when any buffer goes from zero/null to any value. Main buffer also has preference.
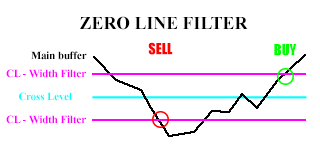
Zero Line Filter: When the main buffer crosses down the level " cross level - width filter ", a SELL signal is given; when it crosses up the level " cross level + width filter ", it's a BUY signal.
Color buffer: The main buffer needs to be a COLOR BUFFER for this mode to work properly (more explanation about color buffers in the next section). When the main buffer changes from any other value to sell color, a SELL signal is given. When its value changes from other value to buy color, a BUY signal is given.
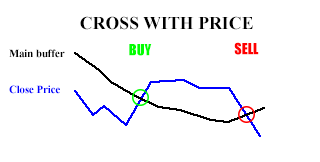
Cross with price: similar to Two Lines Cross. When the price crosses the main buffer up, it's a BUY signal. If it crosses down, it's a SELL signal.
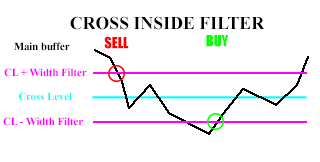
Cross inside Filter: if main buffer crosses down the upper filter (cross level + width filter) a SELL signal is given. If it crosses up the down filter (cross level - width filter), it's a BUY signal.
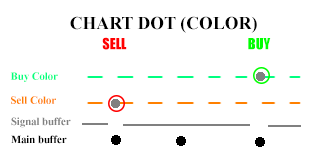
Chart Dot (Color): When the main buffer is non zero/null, the signal buffer (which is a color buffer) determines if it's a BUY or SELL signal (or none).
Over Signal (Colored): When the main buffer crosses above the signal buffer, it gives a signal, and its color determines the direction (color buy or color sell).
Over Level (Colored): When the main buffer crosses above the cross level , it gives a signal, and its color determines the direction (color buy or color sell).
Determining buffer indexes
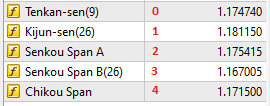
The easiest way to determine your buffers' indexes is usually looking at the data window. The indicators are numbered starting from 0. The example below corresponds to the Ichimoku indicator:
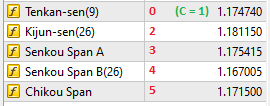
In this case there are no Color or Calculation buffers, so the indexes are correct (All of them are Data buffers, which are the ones shown in the charts). But let's say that the Tenkan-sen buffer has a color buffer attached, then the indexes would be like this:
The Color Buffer with index 1 changes the color of the first buffer (0) in the chart. Any color buffer always changes the buffer below it, and there can be one color buffer for each data buffer (unless the indicator is a color candle indicator, then one color buffer would change the last 4 buffers: open-high-low-close). There can be multiple color buffers in one indicator.
Color Buffers can be detected in the "Colors" tab of the indicator properties:
In this example, you can see how they relate to each other (Color buffer N would affect the buffer N-1). If there is only one possible color, then no color buffer would be needed.
Also, in the "Colors" tab can be determined the indexes of the Buy Color and Sell Color, which are needed when using color buffer or chart color dot modes:

In this example, if you considered green as a buy signal and red as a sell signal, the values would be Buy Color Index = 0, Sell Color Index = 2.
The last thing to consider is Calculations Buffers. Those are buffers which values are stored to avoid recalculations in the indicator, but they are not visible anywhere. These buffers are usually placed at the end so they don't interfere, but if you are getting wrong values after setting the buffers' indexes "correctly", consider that there may be one of these in between.
If you have access to the code, these questions can be answered by searching for a piece of code like this, which is where buffers are assigned. If not, then try adding 1 to your indexes until you get the correct values. This trial-error, which would be the worse case, rarely takes more than a few minutes.
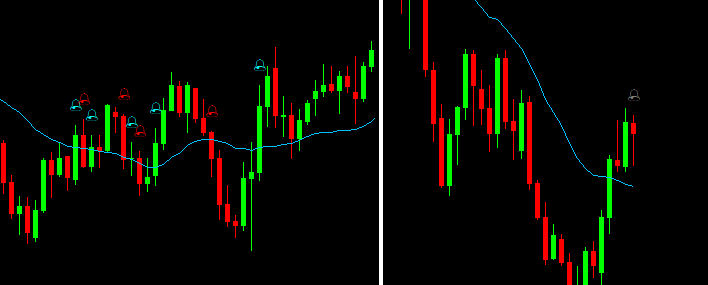
After setting the indicator values, the Universal Alerts Indicator will look like one of these options:
If there are signals, icons will appear at the candles where they occur (in this case the mode is cross with price). If there is not even one signal in all of your symbol history, a gray icon appears on the first candle to allow double-clicking it and continue configuring the indicator correctly.
4. Alert Settings

There are 3 different types of alert that the Universal Alerts indicator can send: common alerts, app notifications or mails. If you use mail or app notifications make sure they are properly configured in your MT5 terminal to do so (and be careful not to breach the Send Notification limits when using multiple instances of this indicator).
The alert cooldown makes the indicator stop giving new alerts for that amount of seconds. If there are multiple instances of the Universal Alerts indicator, each one will have its own independent cooldown.
With "when to alert" you can set the indicator to give you alerts at any moment or only after the candle has closed. In both cases the cooldown applies (but it's especially important if it is set to alert at any moment).
5. Customization Options
Arrow Symbol:
Change the symbol displayed in the charts, between bell, circle, square or arrow.
Icon position in chart: Places the icon above the high price or below the low price.
Icon distance from price: Distance in pixels to the high or low price.
Custom signal messages: If you prefer to get different notifications than the default ones, you can set them there (If the field is empty, the default signal will be used).
Finally, if you get some bugs from this indicator check the log (Experts tab in the toolbox bar) in case it has an easy fix. If you buy this product and find an indicator that is not supported by Universal Alerts, leave a comment or contact me and I'll try to get you the correct settings or update the program depending on the feasibility of the problem.


