Description and work algorithm.
The TrueChannel indicator shows us the true price movement channels. This indicator resembles Donchian Channel in its appearance, but is built on the basis of completely different principles and gives (in comparison with Donchian Channel, which is better just to use to assess volatility) more adequate trading signals.
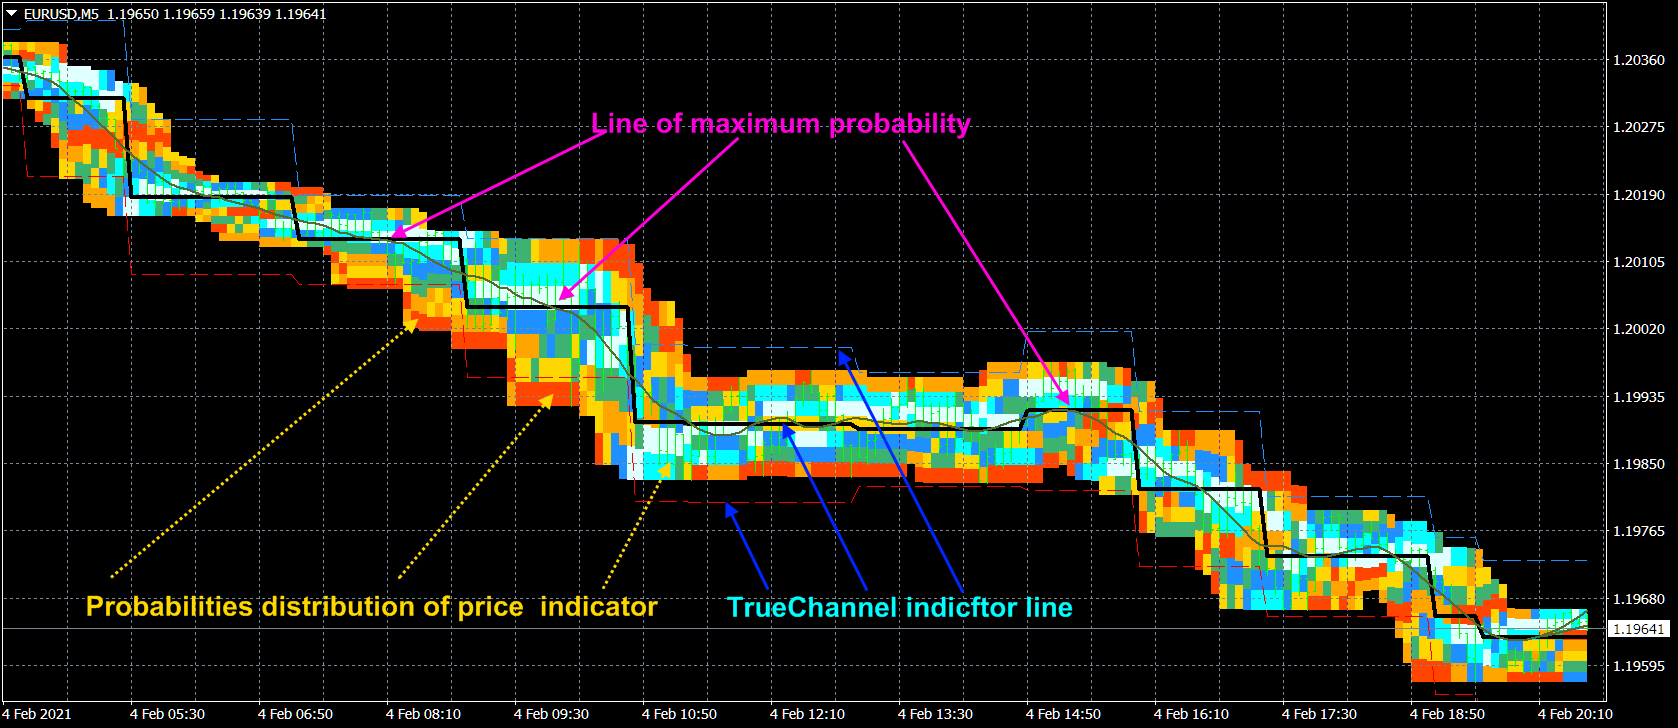
As shown in the article « True and illusory currency market trends » the price actually moves in channels parallel to the time axis and jumps abruptly from the previous channels to the subsequent ones. The Probabilities distribution of price (PDP) indicator allows to establish such price movement. The TrueChannel indicator builds channels similar to those detected by the PDPindicator, but based on simpler algorithms.
The middle line of the TrueChannel indicator is a set (of different lengths) horizontal segments, each of which follows the arithmetic mean of the price points surrounding it. In this case, each segment is constructed until the variance or spread of price points around it begins to exceed a certain critical value, after which the construction of this segment ends and the construction of the next segment begins. This approach is due to the fact that the price variance around such segments begins to grow strongly with its large jumps and with an increase in its volatility, which take place when the trend movement changes, which allows tracking the moments of true price jumps.
The number of points for plotting each line segment is variable and depends on the market situation described by the indicator, but it can vary from Backstep to Depth , which are set in the indicator settings. Moreover, the smaller the Backstep , the smaller the lag, with which the beginning of the price jump is determined.
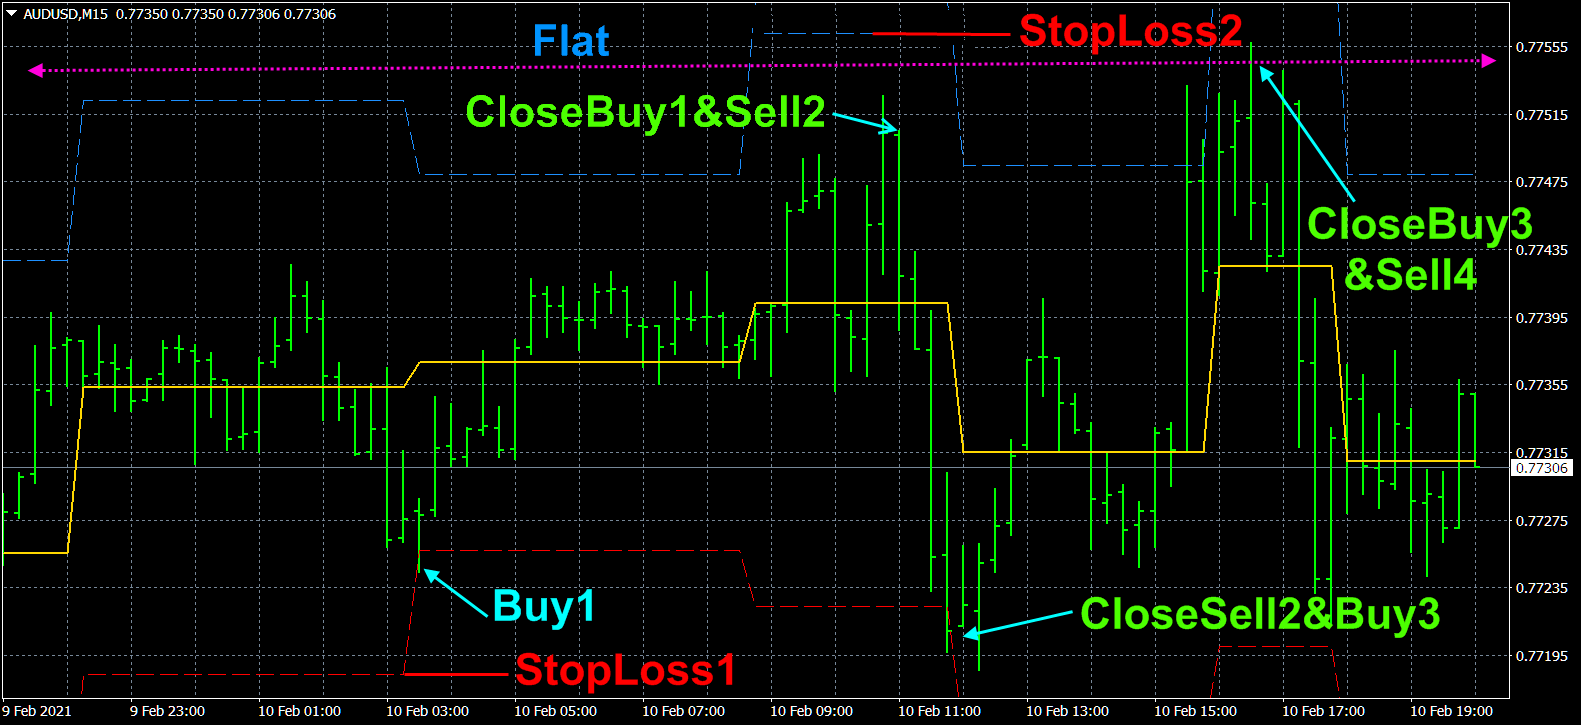
For each segment of the middle line of the TrueChannel indicator, the price variance relative to this segment is calculated and, with the Channel width factor set in the settings, is plotted on both sides of it, which (with the correct selection of the multiplier) gives the true channel of price fluctuations. At the same time, on the lower (red) line of such a channel, you can set StopLoss for buy orders, and on the upper (blue) line - StopLoss for sell orders.
The TrueChannelindicator, being the most optimal filter, does not react to simple price volatility and its insignificant movements. At the same time, TrueChannel draws its channels not by individual single peaks and troughs (as most channel indicators do), which can be in the form of strong unlikely price jumps, but based on statistics of a large set of points, which ensures the reliability of its readings.
Using the TrueChannel indicator in trading.
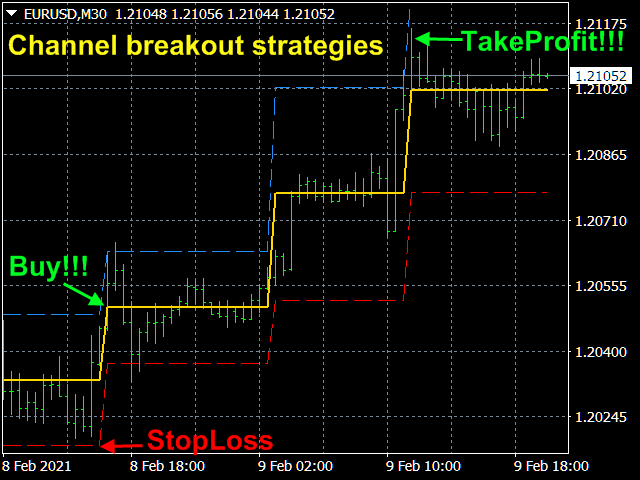
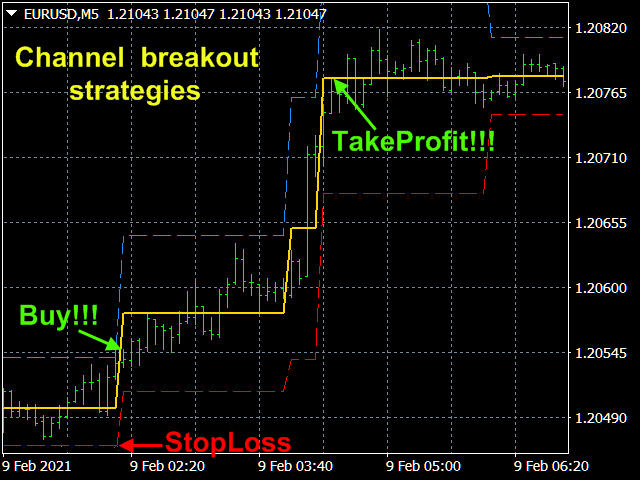
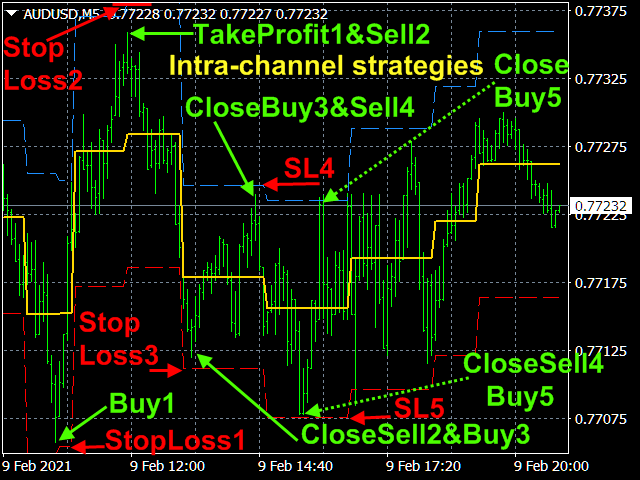
The TrueChannel indicator can be used both in intra-channel strategies and in channel breakout strategies. But with any strategy (and this is the main thing), you need to rely on an already fairly established channel, when its width stops changing noticeably, and the middle line is moving.
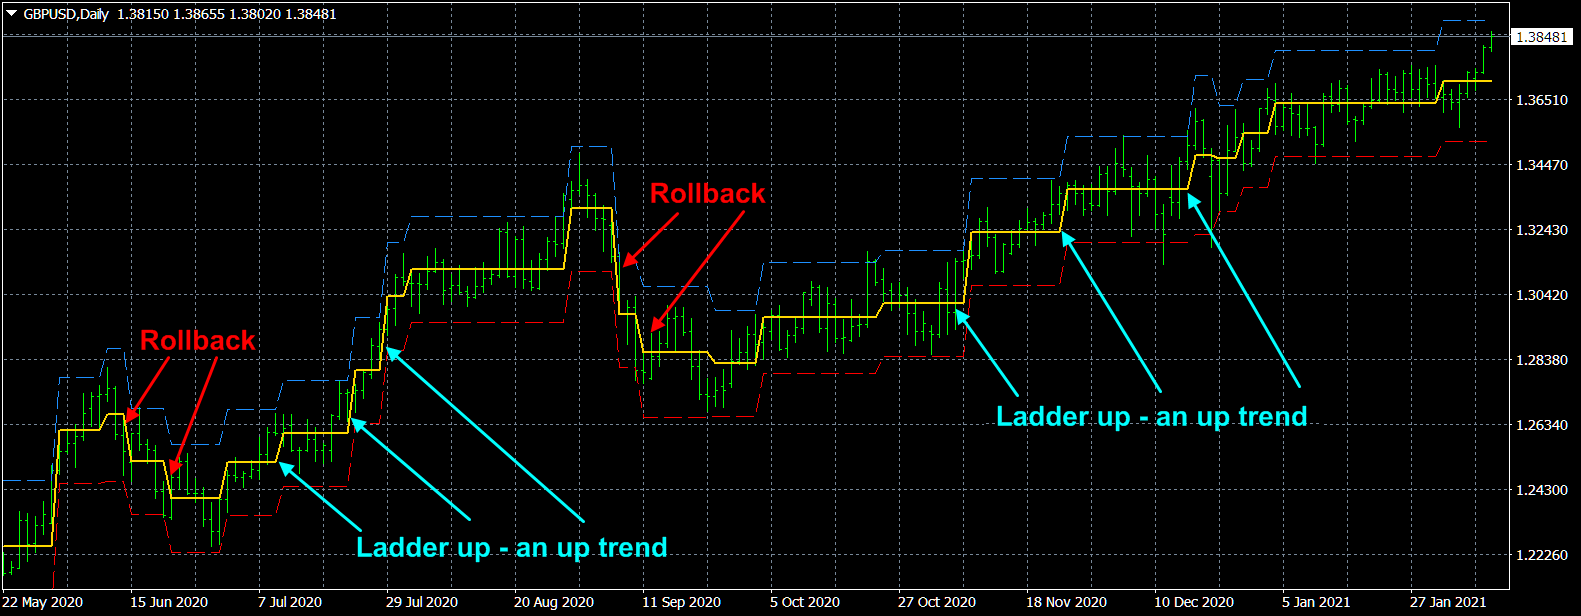
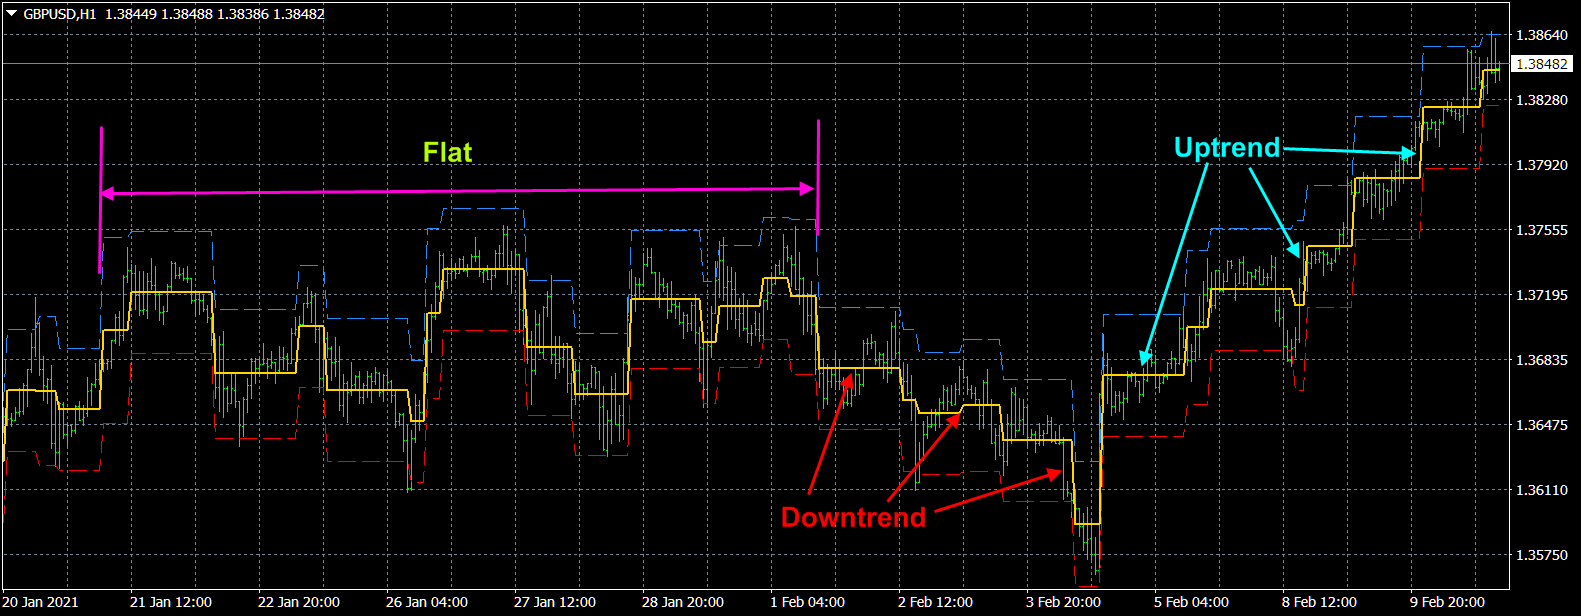
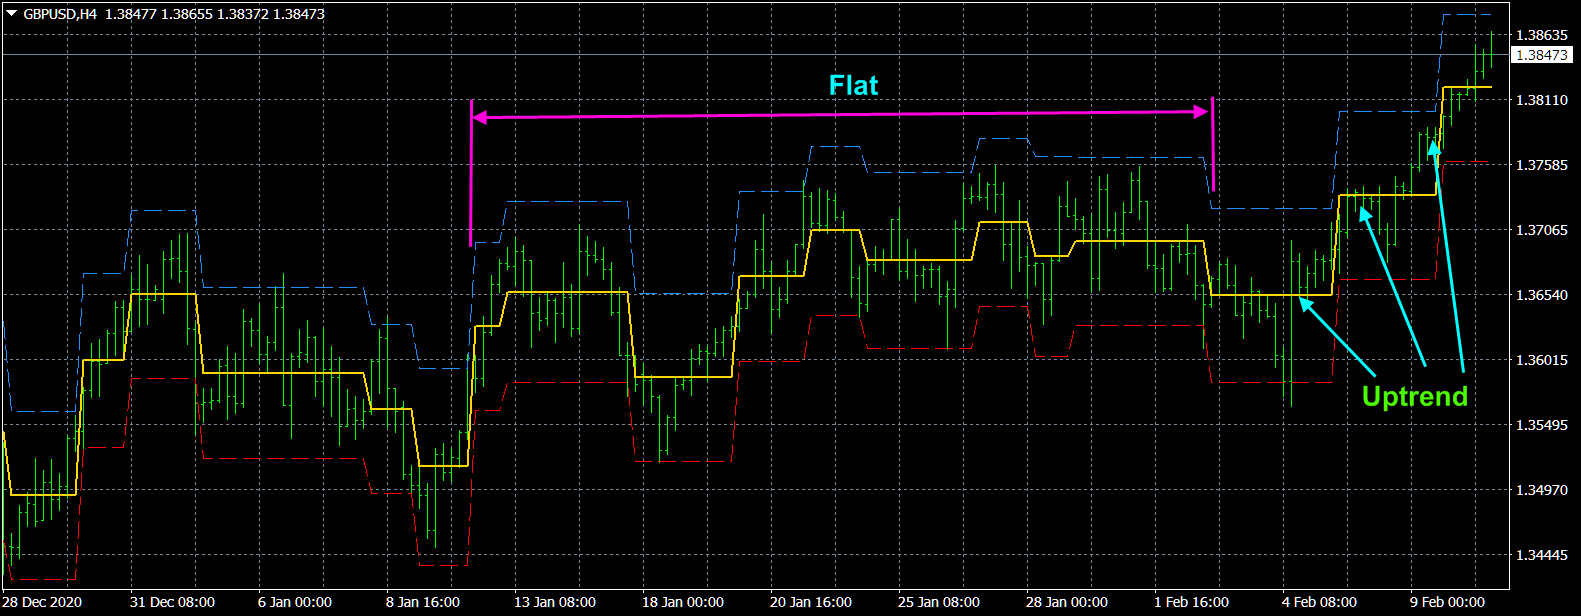
Looking at the TrueChannel indicator readings on a large scale, it is easy to establish the direction of the trend. An uptrend as seen by the TrueChannel indicator looks like an upward staircase made up of horizontal steps; while a downtrend looks like a down staircase, i.e. the trend essentially consists of a sequence of unidirectional jumps between the elementary sections of the flat. The channel breakout strategy gives a more reliable signal when the channel breaks out in the direction of the global trend that includes it. And it is in the direction of this trend that you need to open positions.
In the channel breakout strategy, orders are opened when the price falls below the lower border of a sufficiently stable channel (then a sell order is opened) or rises above its upper border (a buy order).
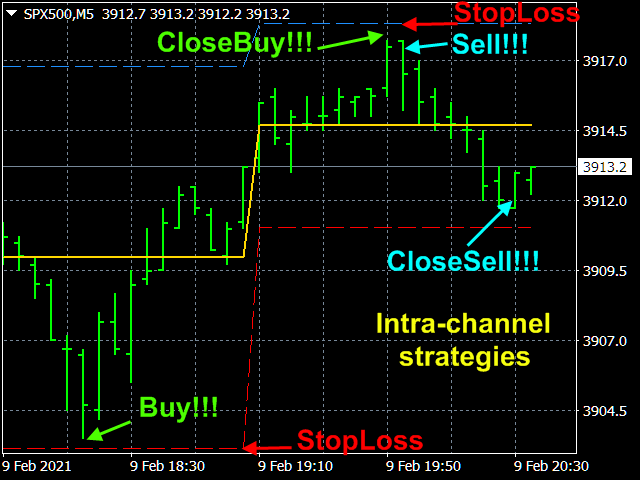
In-channel strategies are best used when there is no clear trend. At the same time, on a large scale, the TrueChannel indicator readings look like small, differently oriented jumps, which constitutes a large flat structure.
With an intra-channel strategy, orders must be opened when the price bounces off the channel border and starts moving towards the opposite border (reflection from the lower border is a buy order, reflection from the upper border is a sell order).
In addition, the channels drawn by the TrueChannel indicator allow you to reliably place StopLoss positions.
Indicator settings.
- Price type - applied price. Values: Close price, Open price, High price, Low price, Median price ((high + low)/2 default), Typical price ((high + low + close)/3), Weighted price ((high + low + 2*close)/4).
- Backstep - Minimum distance between price jump (>=3Bars) Values: any positive integer greater than 3 but less than Depth. (3 default)
- Depth - Maximum distance between price jump (<=60Bars). Values: any positive integer less than 60 but greater than Backstep. (20 default).
- Maximum price variance relative to the line. Values: any positive real number (1.0 default).
- Channel width factor – Factor giving the width of the channel around the centerline. Values: any positive real number (3.0 default).
Screenshots.