Weekly and Daily Charts Explanations -TRADING WITH WEIS WAVE WITH SPEED INDEX
31 May 2020, 12:04

0
109
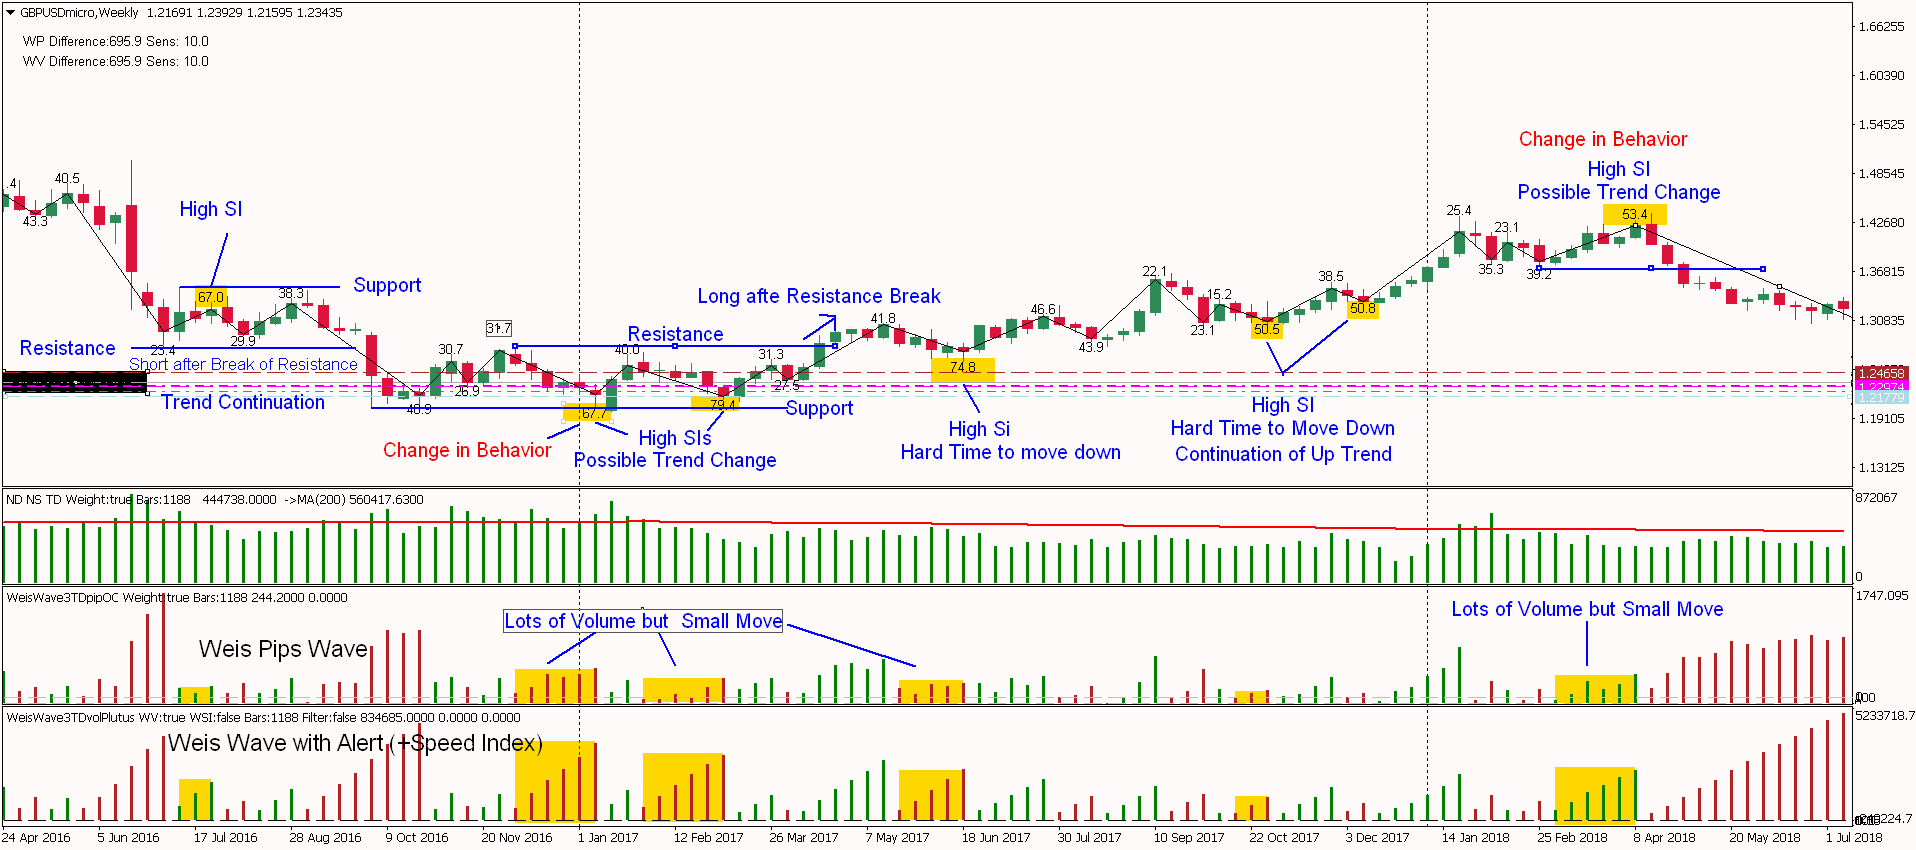
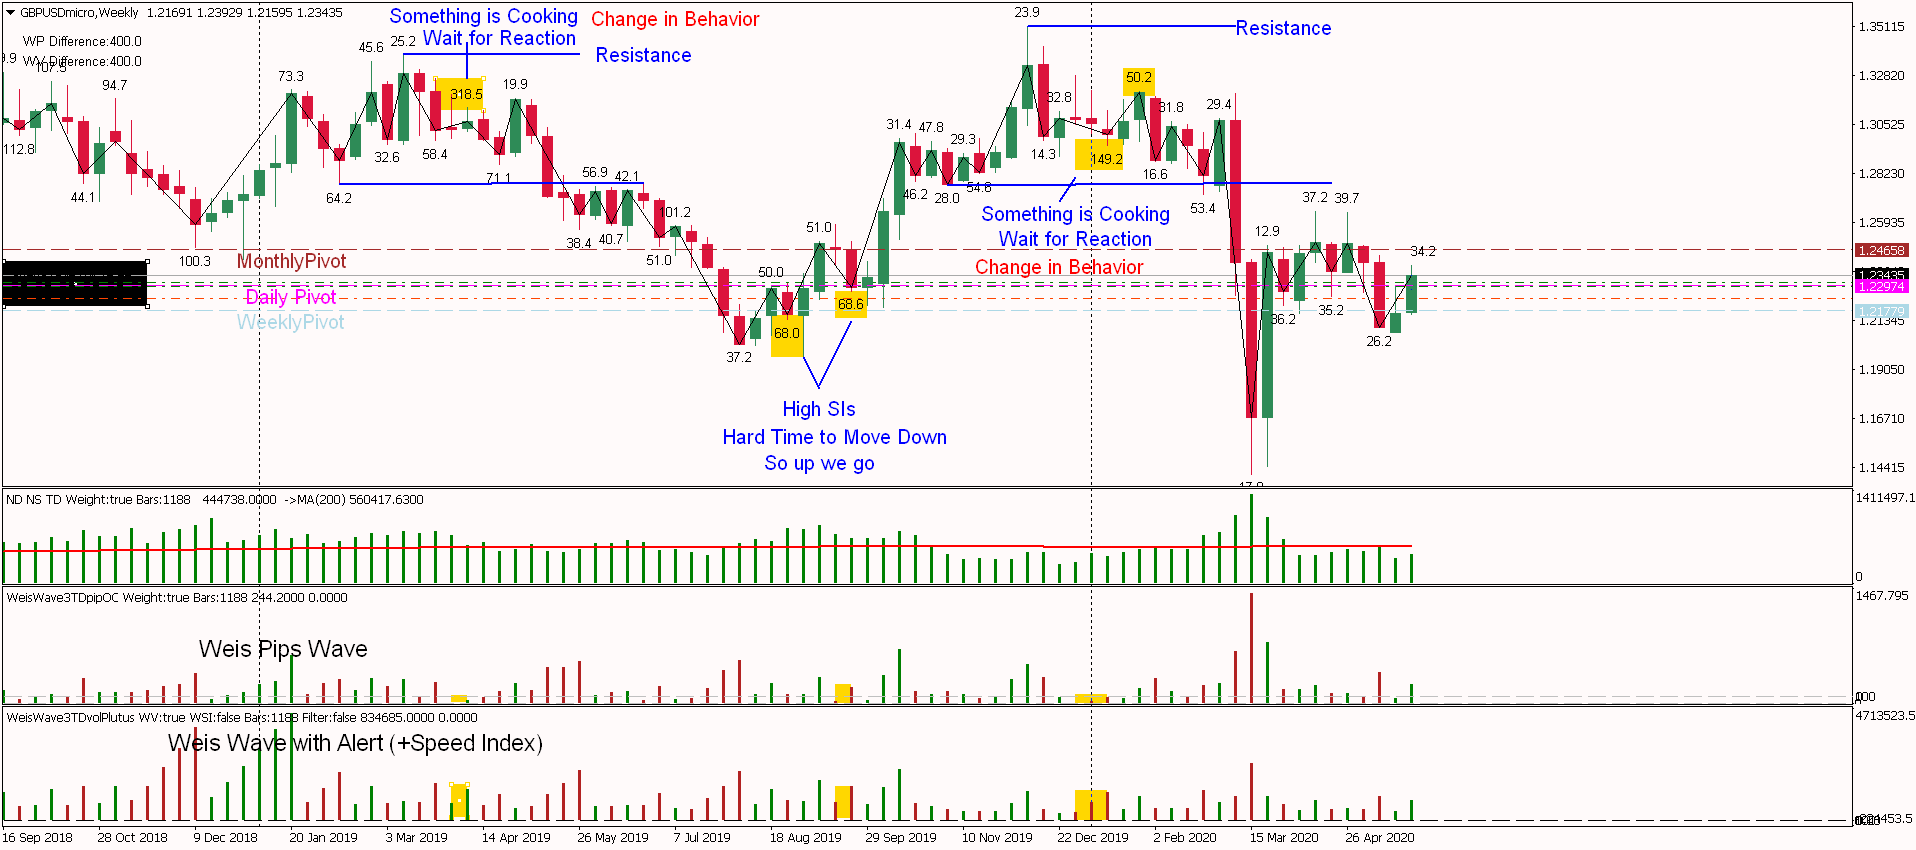
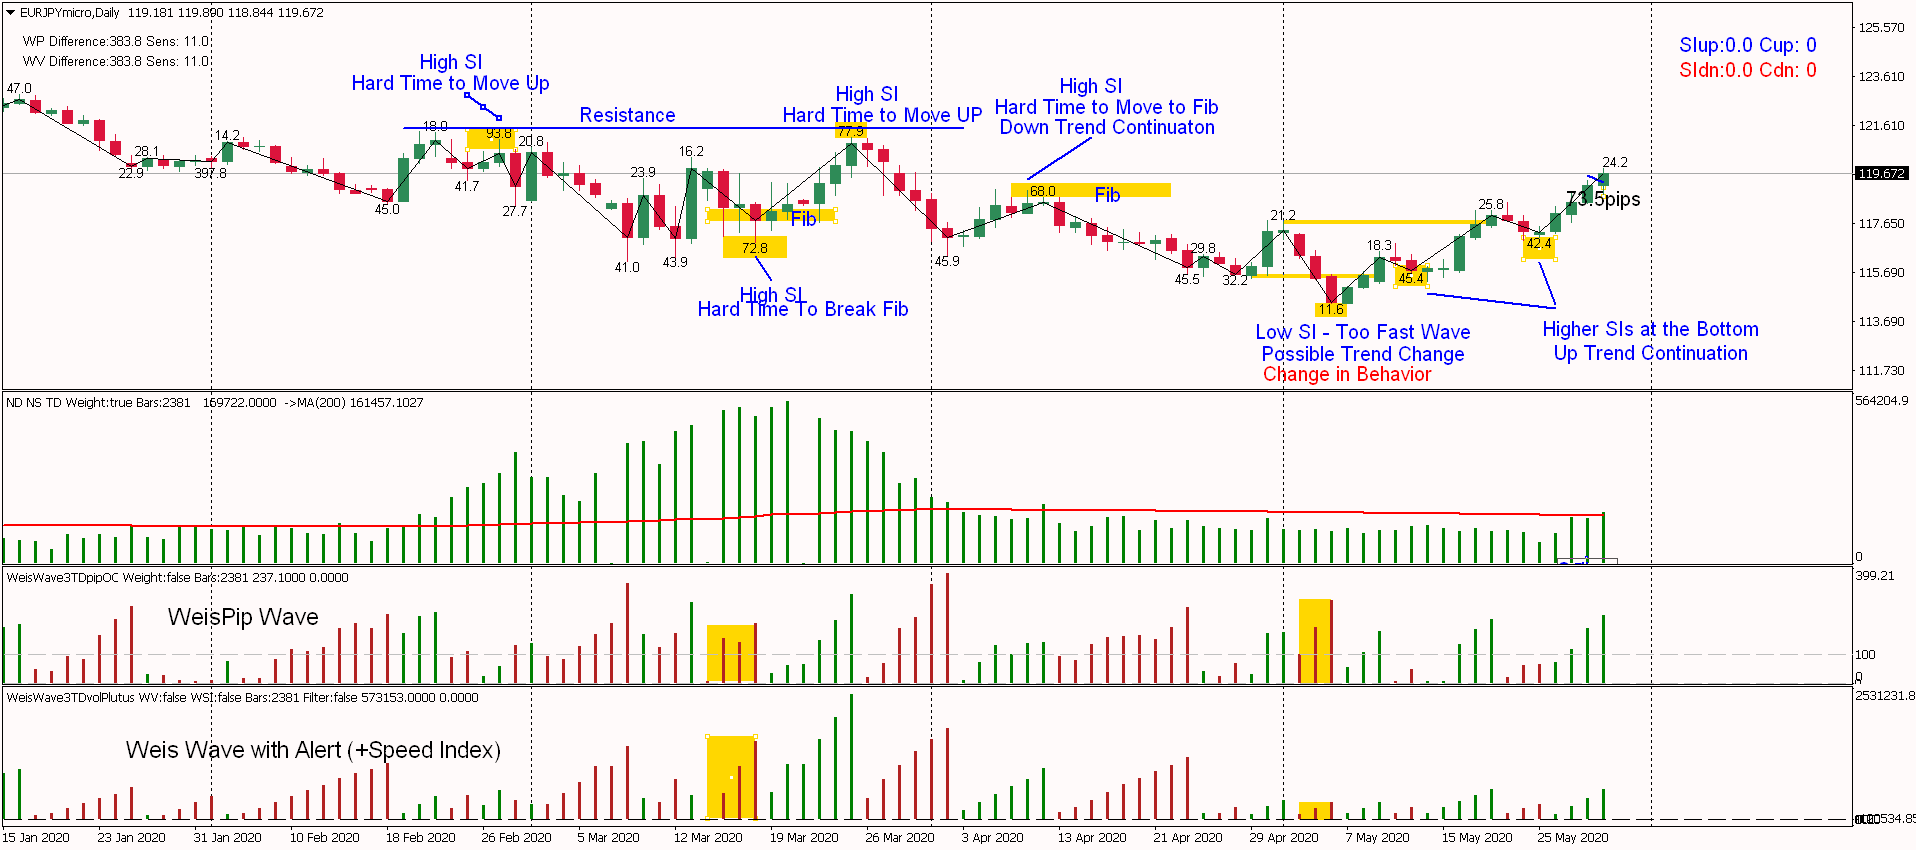
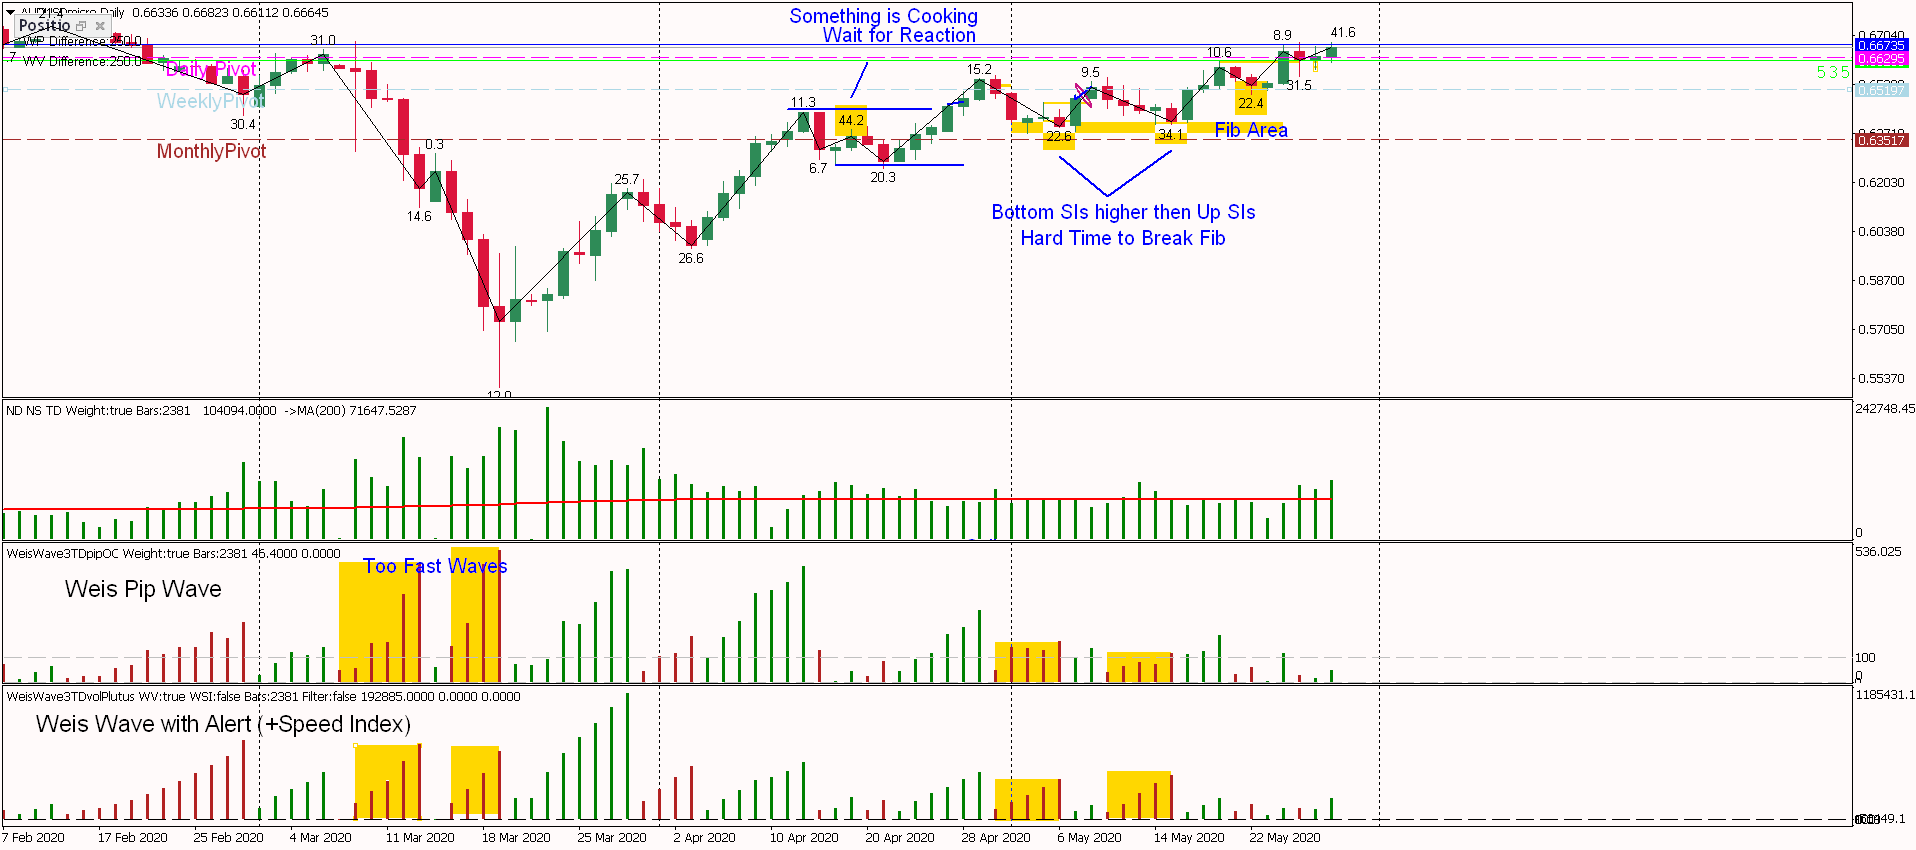
Chart Indicators: Weis Pip Wave, Weis Wave with Alert (+Speed Index) and No Demand No Supply ( https://www.mql5.com/en/users/takisd/seller)
I had a question if the indicators work on Daily and Weekly charts and the answer is ofcourse they do, if you know how to read the charts with them. So this how, my comments are on the charts.
A nice strategy would be to get your Bias from these high timeframes and use as entry points the 1HR.
This is magic of Speed Index.