
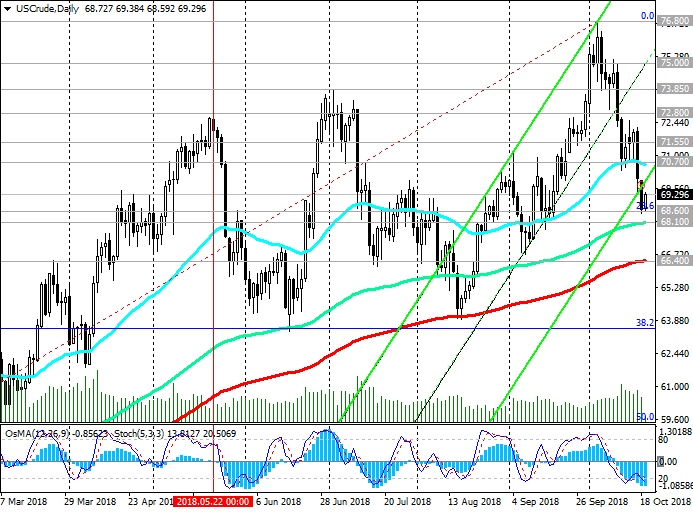
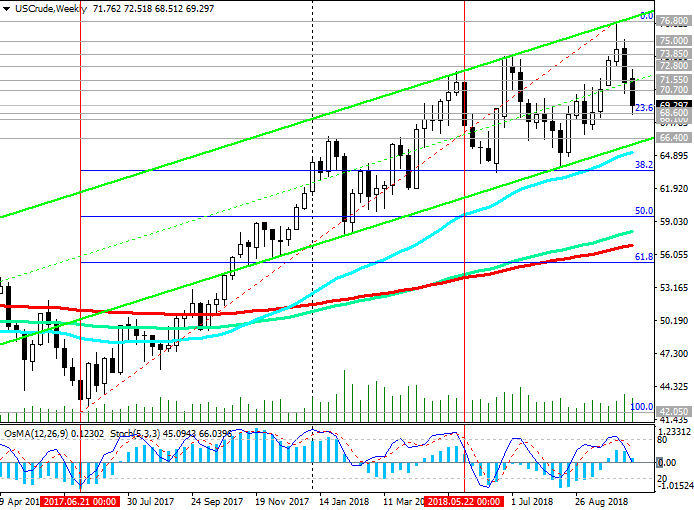
On Friday, the price of WTI crude oil reached an important support level of 68.60 (Fibonacci level 23.6% of the correction to the growth wave that started in June 2017 from the level of support near the 42.00 mark), after which an upward correction began. Just below is another strong support level of 68.10 (EMA144 on the daily chart).
As long as the price is above the key support level of 66.40 (ЕМА200 on the daily chart and the bottom line of the ascending channel on the weekly chart), the long-term uptrend remains.
If the price returns to the zone above the resistance level of 70.70, long positions will again become relevant.
The overall trend is still bullish. The growth targets in the event of a resumption of positive dynamics are located at the resistance levels of 73.85 (July highs), 75.00, 76.80 (annual and multi-year highs).
We are awaiting publication (at 17:00 GMT) of the weekly report of the American oilfield service company Baker Hughes on the number of active oil drilling rigs in the USA. If the report indicates a further increase in the number of drilling rigs (at the moment their number is 869 units), this will have an additional negative impact on oil quotations.
Support Levels: 68.60, 68.10, 66.40
Resistance Levels: 70.70, 71.50, 72.00, 72.80, 73.85, 75.00, 76.80
Trading Scenarios
Sell Stop 68.50. Stop Loss 69.80. Take-Profit 68.10, 66.40
Buy Stop 69.80. Stop Loss 68.50. Take-Profit 70.70, 71.50, 72.00, 72.80, 73.85, 75.00, 76.80
*) For up-to-date and detailed analytics and news on the forex market visit Tifia Forex Broker website tifia.com


