

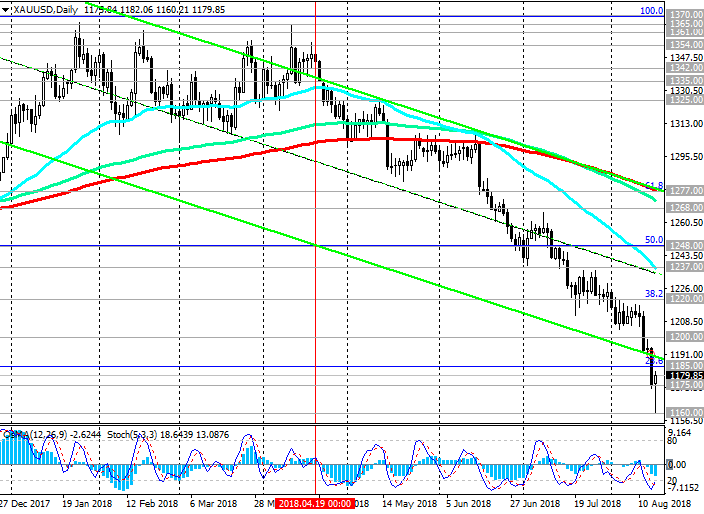
Since mid-April, XAU / USD is trading in a downtrend. Below the key resistance level of 1277.00 (EMA200 on the daily chart and the Fibonacci level of 61.8%) is dominated by a downward trend.
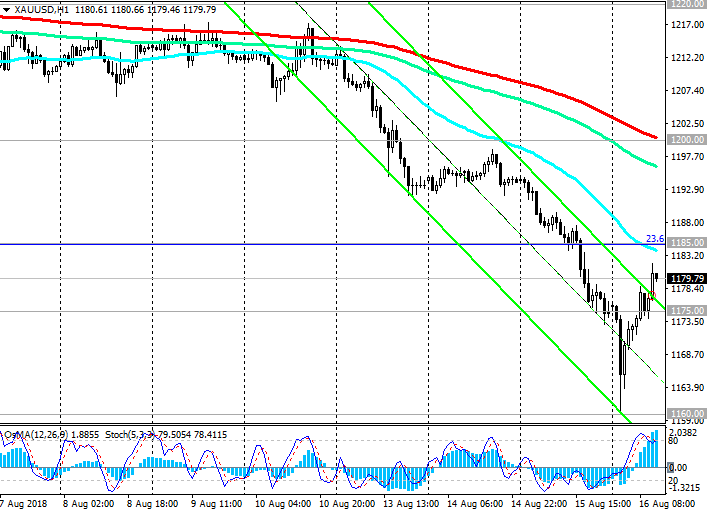
On Thursday, the pair XAU / USD moved into the corrective phase, consolidating to the nearest resistance level at 1185.00 (Fibonacci level of 23.6% of the correction to the wave of decline since July 2016).
The signal for buying and developing an alternative scenario will be a breakdown of the short-term resistance level 1200.00 (EMA200 on the 1-hour chart). In this case, corrective growth can last up to resistance level 1220.00 (EMA200 on the 4-hour chart and Fibonacci level of 38.2%). Below this level, sales look safe.
Short positions are preferred. The XAU / USD on Wednesday broke the last strong support level at 1185.00 (the Fibonacci level 23.6% of the correction to the wave of decline since July 2016).
The breakdown of the support level of 1185.00 (the Fibonacci level of 23.6%) could mean the return of XAU / USD to the global downtrend, which began in October 2012.
*)An advanced fundamental analysis is available on the Tifia Forex Broker website at tifia.com/analytics
Support levels: 1175.00, 1160.00, 1128.00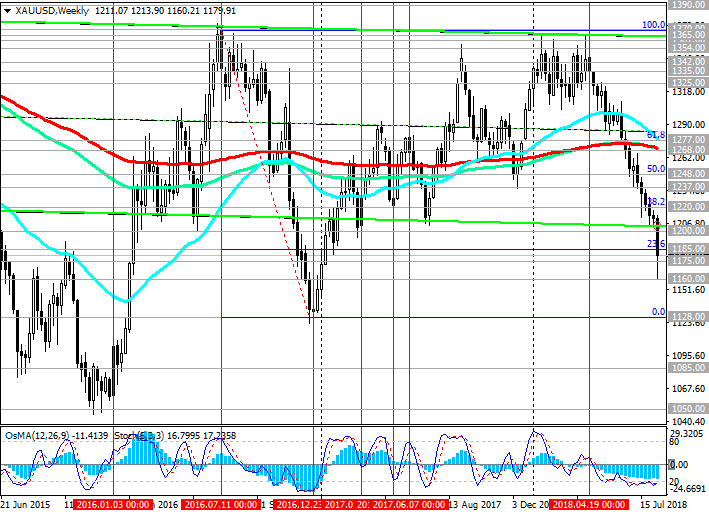
Resistance levels: 1185.00, 1200.00, 1220.00, 1237.00, 1248.00, 1268.00, 1277.00
Trading Scenarios
Sell Stop 1174.00. Stop-Loss 1186.00. Take-Profit 1170.00, 1160.00, 1120.00, 1128.00
Buy Stop 1186.00. Stop-Loss 1174.00. Take-Profit 1200.00, 1220.00, 1237.00, 1248.00, 1268.00, 1277.00
*) For up-to-date and detailed analytics and news on the forex market visit Tifia Forex Broker website tifia.com


