 Manual and Settings Description")

![]()
![]()
Product Name: All-in-One Trade Indicator (AOTI)
Product URL: https://www.mql5.com/en/market/product/9995
Currency Pairs: EURUSD, EURJPY, GBPUSD, USDCHF, EURGBP, EURCAD, EURAUD, AUDJPY, GBPAUD, GBPCAD, GBPCHF, GBPJPY, AUDUSD, and USDJPY for the Daily Levels detection. Any for other features.
Working Time Frame: Any, but M5 recommended
Trading Platform: MetaTrader 4
Testimonials: Read More
Brokers for Trading: Read More

![]()
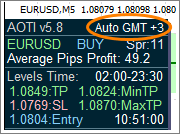
AOTI Info Panel and Control Buttons
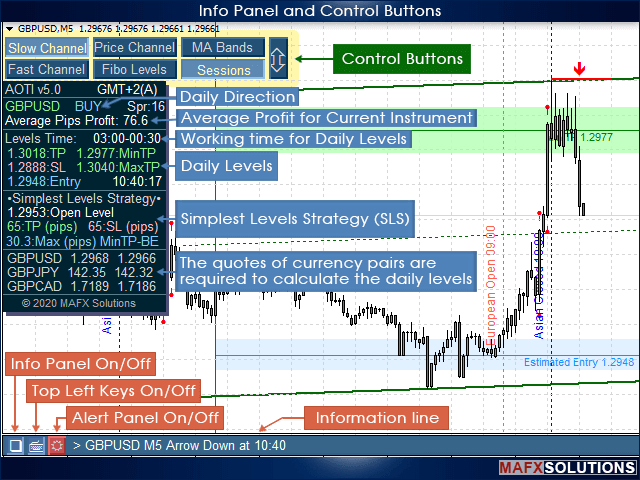
Main Control Panel with Information line:
![]() - Enable/Disable the indicator Information Panel;
- Enable/Disable the indicator Information Panel;
![]() - Enable/Disable the Control Buttons in the upper left corner;
- Enable/Disable the Control Buttons in the upper left corner;
![]() - Enable/Disable the indicator Alert Panel.
- Enable/Disable the indicator Alert Panel.
Control Buttons:
![]() - Enable/Disable Slow (Long) Channel;
- Enable/Disable Slow (Long) Channel;
![]() - Enable/Disable Fast (Short) Channel;
- Enable/Disable Fast (Short) Channel;
![]() - Enable/Disable Price Channel;
- Enable/Disable Price Channel;
![]() - Enable/Disable Fibo Levels;
- Enable/Disable Fibo Levels;
![]() - Enable/Disable MA Bands;
- Enable/Disable MA Bands;
![]() - Enable/Disable the Trading Sessions;
- Enable/Disable the Trading Sessions;
![]() Y-Scale Levels - Enable/Disable vertical scaling of levels to see all levels on the chart at the same time.
Y-Scale Levels - Enable/Disable vertical scaling of levels to see all levels on the chart at the same time.
![]()
AOTI First Start and Loading Additional Historical Data
The process of calculating daily levels is complex, and the AOTI indicator uses a lot of data to determine them. The calculation process uses price movements, correlation of currency pairs, analysis of speed, volume, and price spread, and some other data for individual currency pairs. The indicator calculates levels on various time frames, currency pairs, and checks their performance and strength to determine the optimal and potentially powerful levels for the current day. Daily levels appear at the beginning of a new trading day. The exact time depends on the GMT Offset value.
Due to the peculiarities and difficulties of calculating daily levels, the AOTI indicator requires additional historical data for various currency pairs, including historical data for currency pairs, without calculating daily levels.
Update for v8.0 and higher:
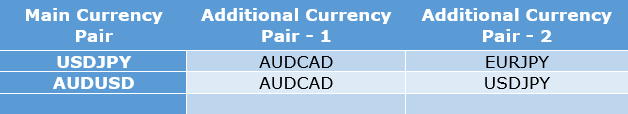
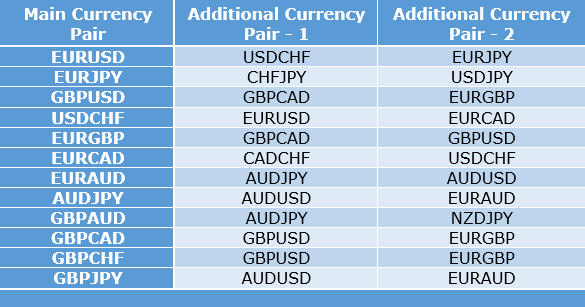
For example:
- If you want to calculate daily levels for the EURUSD currency pair, you need to download historical data for the main EURUSD pair and additional pairs: USDCHF and EURJPY
- For the GBPUSD currency pair, you need to download historical data for the GBPUSD pair and additional GBPCAD and EURGBP
If your terminal is new, or installed recently, and you are running an indicator to calculate daily levels, you may receive the following message:
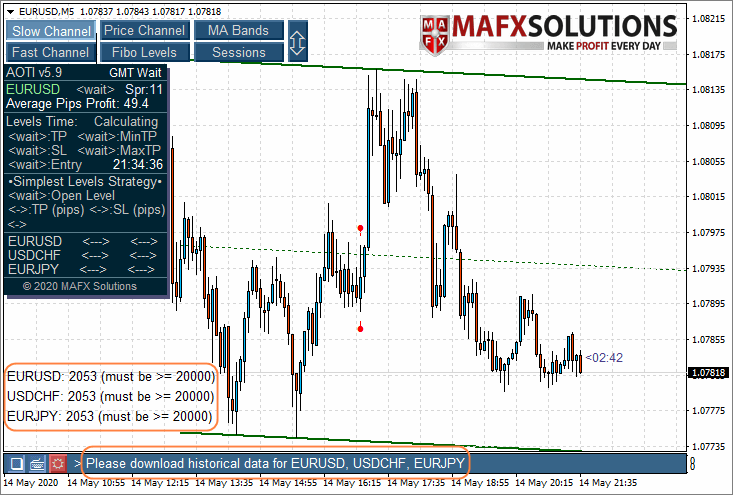
Please set the values for the following variables and download the historical data:
Max bars in history – set this value to equal, or higher than 250000.
Max bars in chart – for the AOTI indicator, you need to set the value 20000-50000 (depending on the power of your computer). The recommended value is 25000.
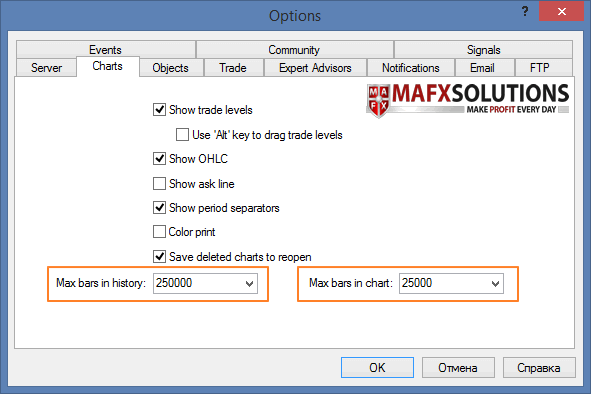
We do not recommend setting the Max bars in chart value > 50000 to avoid memory leaks during calculations, due to a large number of currency pairs!
How to Download Historical Data

![]()
Daily Levels Automatic Calculation
At the very beginning, the indicator switches to initialization mode, which continues for some time. At this time, the indicator determines the necessary parameters for operation, such as GMT Offset and others. We do not recommend switching timeframe or changing price chart parameters at this time!
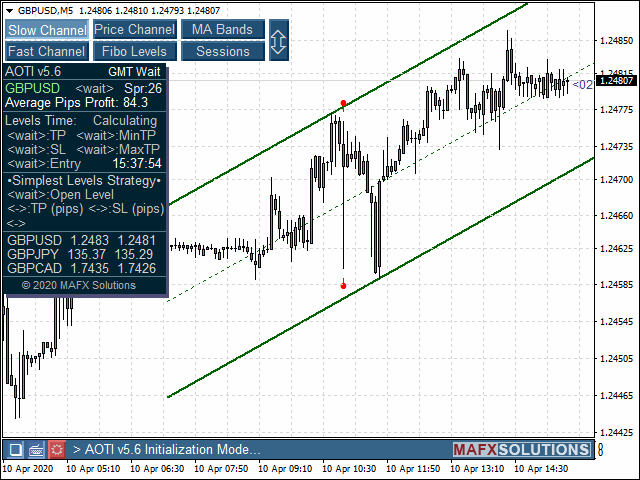
After that, the indicator automatically proceeds to calculate daily levels:
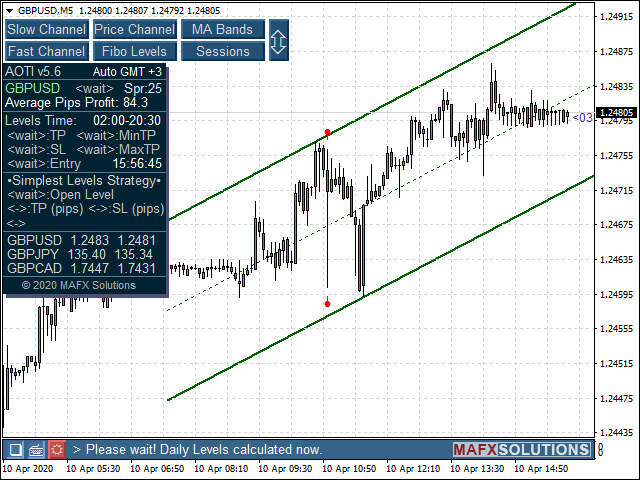
Don't switch the timeframe and don't change the price chart during calculating the daily levels!
![]()
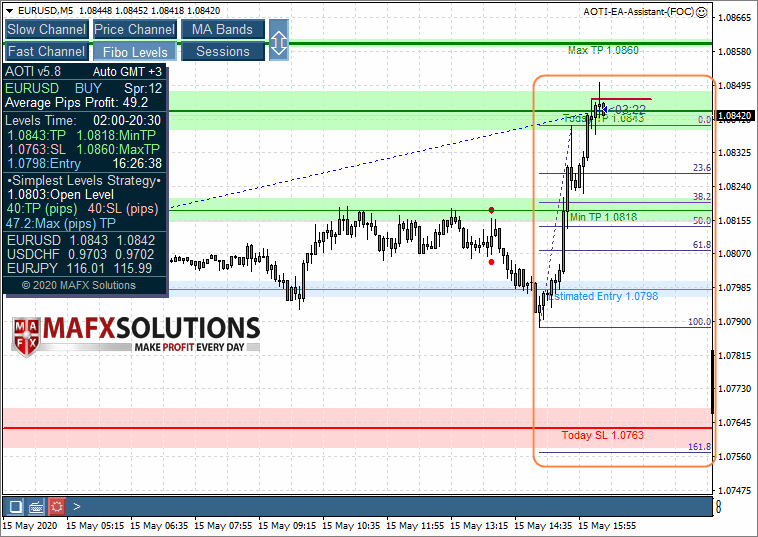
What is the Open Level, Today TP, Today SL, and Max (pips) TP?
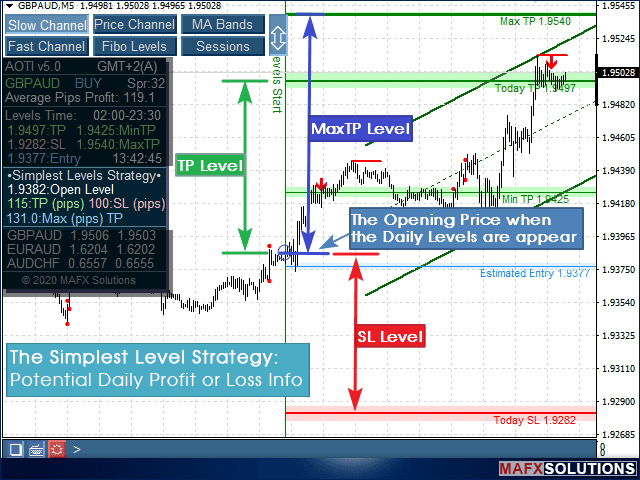
The Max (pips) TP level is necessary to quickly see how much the price has passed from the Open Level to the Today TP.
If the Today SL Level is much higher than the Today TP Level, then the best way is to try to avoid opening a position. If you are an experienced trader then you can open position in the presence of additional signals. We recommend using all the features of the indicator and not just the simplest levels strategy. With these skills, you can make much more profit and reduce losses. Yes, this requires practice, but as a result, you will not be afraid of any market situation.
![]()
Additional Features and Signals of the All-in-One Trade Indicator (AOTI)
Daily levels calculated for 12 currency pairs in version 5.0 and higher of the AOTI indicator. All other features of the indicator work for any currency pairs and instruments.
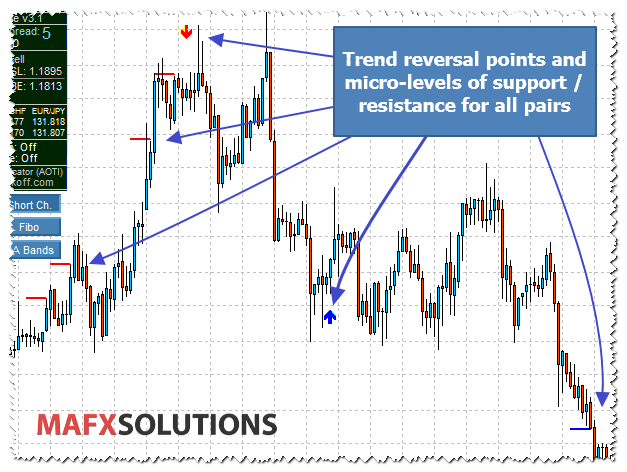
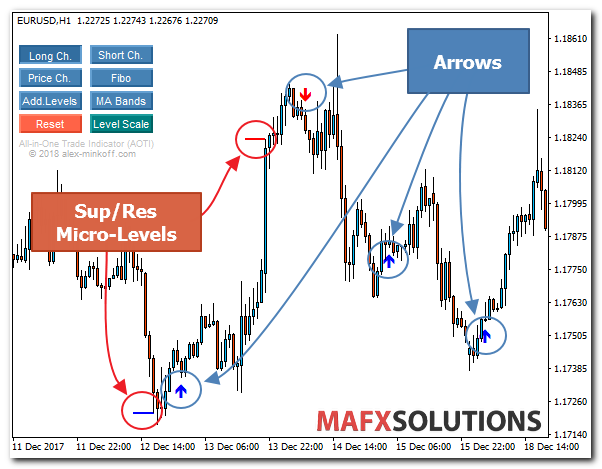
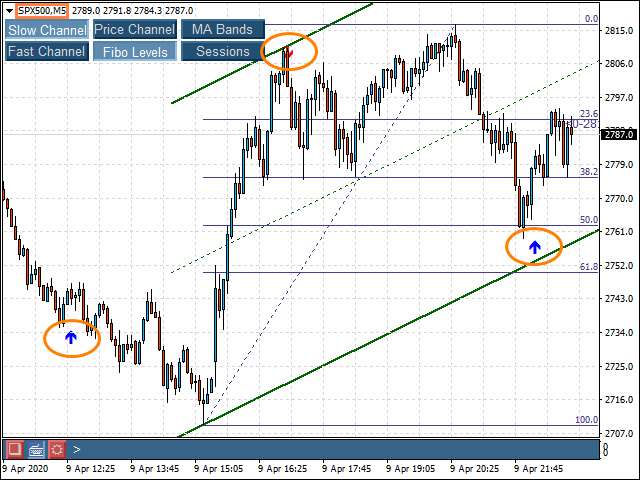
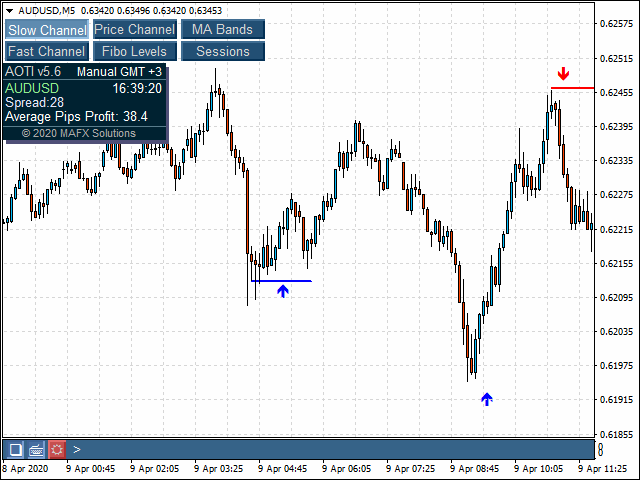
Reversal Arrows and Support/Resistance Micro-Levels
Reversal Arrows settings:
![]()
A few more examples:
In the example below, support/resistance micro-levels (short blue lines), outlined with a red oval. These levels show price weakness. It's not yet a reversal signal, but it is close to it. If bears do not support the price, then the probability of price reversal will high.
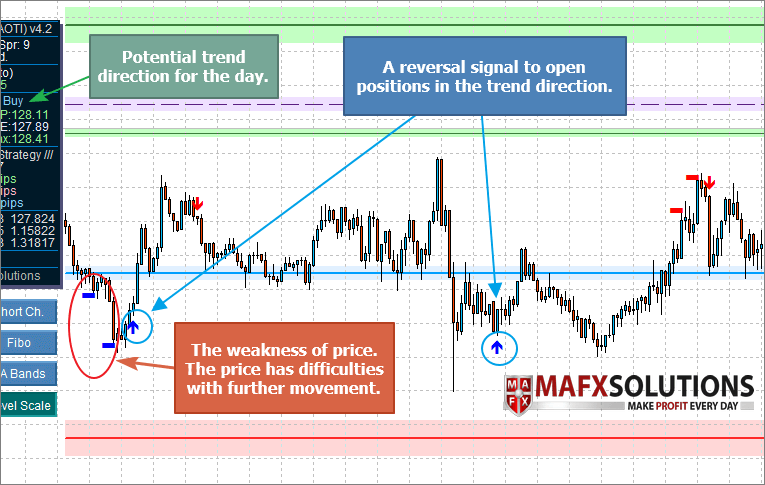
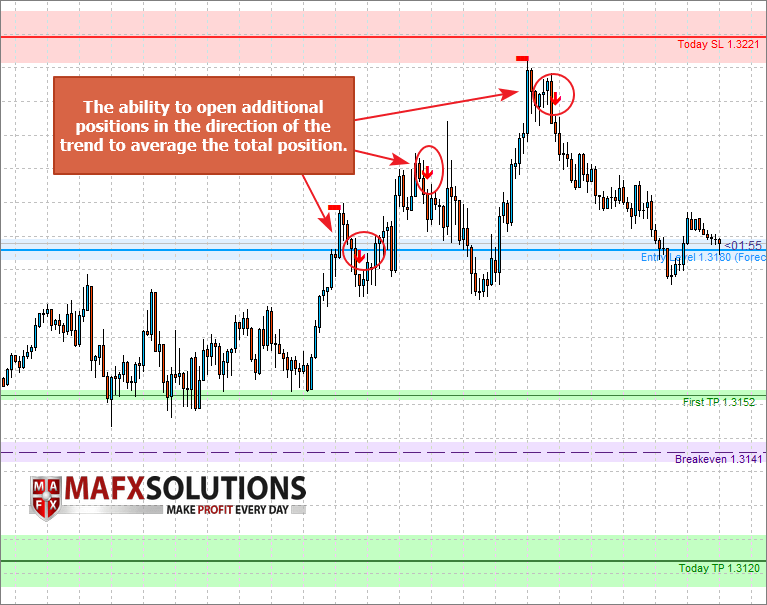
We can open additional positions in the direction of the current trend. The main signs of this are a weakening of the price movement and a reversal signal. In this case, we can withdraw our position to 0 or even profit. This strategy is quite risky, and I recommend it only to experienced traders. I'm actively using it in trading.
The weakness of prices. Also, we see a reversal signals against the trend. But at this time, our position is already breakeven, so we can stay in the market. The signals are against the trend direction, so they rather mean the possibility of a price pullback. We wait a bit, and the bulls help the price overcome this resistance, and the price comes to our target level.

![]()
MA Channel Angle
The MA Channel Angle allows you to determine the strength of the current movement and fix the profit at the right time.
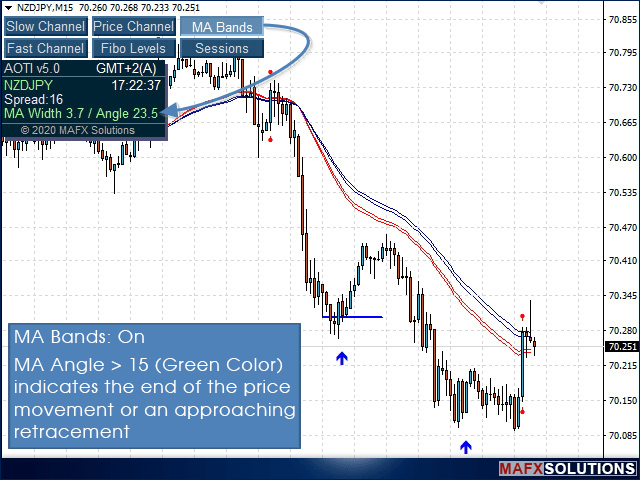
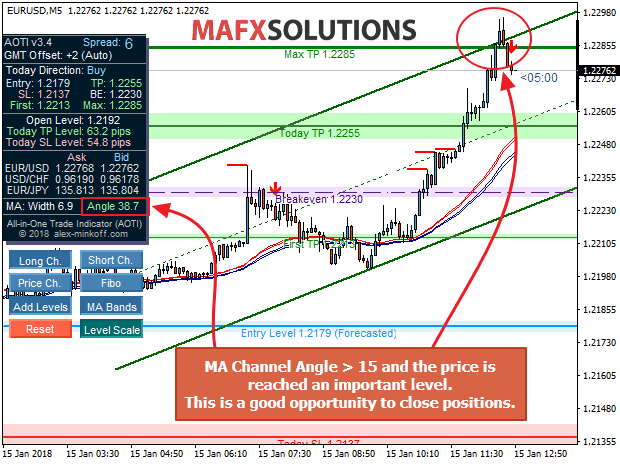
This feature (MA Angle) is one of the ways to fix profits. If we have a target level, we can close a position on it. But if we trade on an instrument for which there are no target levels, or open a scalper position against the trend, we can fix the profit with MA Angle helping.

![]()
Climax Bar
The Climax Bar near significant levels means increasing volume. At this point, we can fix the profit (this level can become a reversal) or pull up the stops, waiting for the price break level.
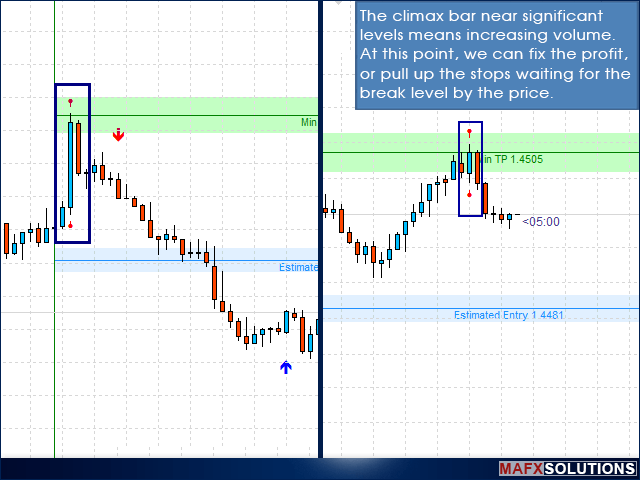
Let's look at an example:
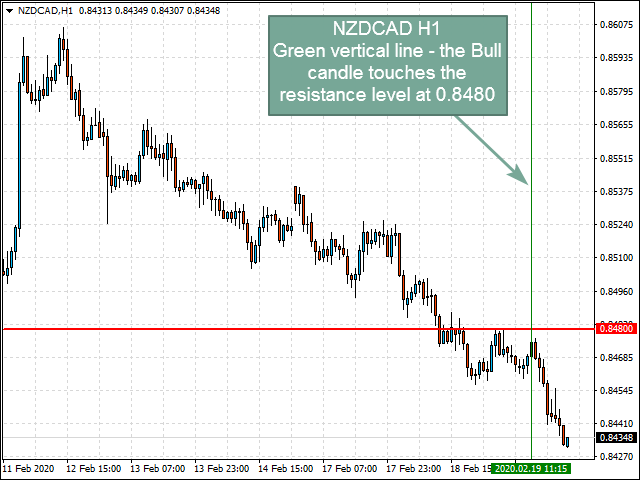
NZDCAD Н1 (green vertical line) – the Bull candle touches the resistance level at 0.8480
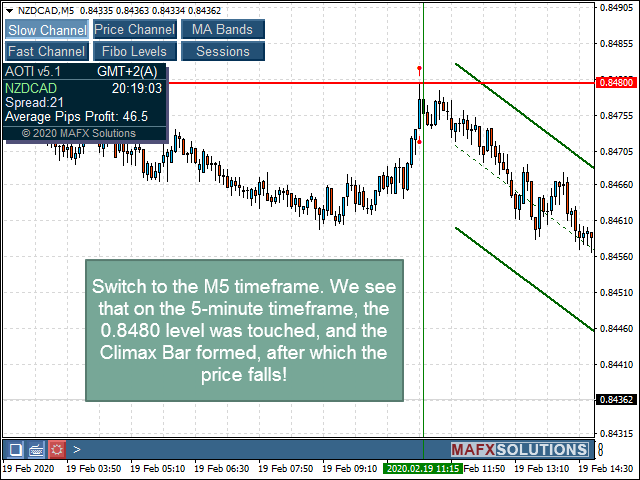
Let's switch the time frame to M5. On the 5-minute time frame, the price touched the level of 0.8480 and formed a culminating bar. This is an excellent opportunity to open a position to rebound from the resistance level while waiting for further downward movement. The price continued falls on the next candle!
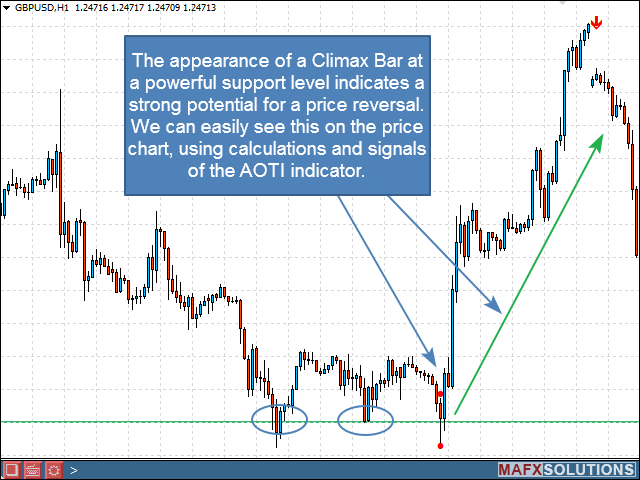
Another example, meanwhile. The appearance of a Climax Bar at a powerful support level indicates a strong potential for a price reversal. We can easily see this on the price chart, using calculations and signals of the AOTI indicator.
![]()
All-in-One Trade (AOTI) Settings
>>> GMT Offset Settings
It's one of the most important indicator settings.
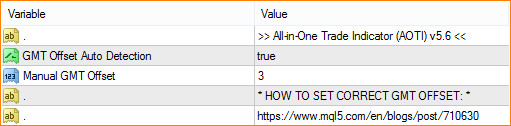
GMT Offset Auto Detection - Enable/Disable automatic detection of GMT Offset;
Manual GMT Offset - manual GMT Offset settings, if GMT Offset Auto Detection is false
![]()
GMT Offset is necessary for correct calculation of the Daily Levels. The AOTI indicator can detect GMT Offset automatically. To do this, set the GMT Offset Auto Detection = true.
Weekends (Saturday and Sunday) are an exception because, on these days, the broker's time remains unchanged, and it is not possible to determine the GMT Offset automatically. At this time, the GMT Offset value is taken from the Manual GMT Offset variable, instead of automatically calculating it.
![]()
I recommend that you take the following steps when you first install the AOTI indicator:
1). During the broker's working hours, set the GMT Offset Auto Detection = true and determine the GMT Offset value, which is automatically calculated by the AOTI indicator.
2). Set this value to the Manual GMT Offset variable. When you launch the indicator on the weekend, and the terminal memory has levels calculated on Friday, the AOTI indicator will correctly position them on the chart, according to the Manual GMT Offset variable.
![]()
You can also find out your broker's GMT Offset as follows:
If you don 't run the terminal on weekends, just set the GMT Offset Auto Detection = true, and that's it.
Additional Inforamtion:

![]()
>>> Indicator Section
Slow and Fast Channels Settings
Slow Channel Bar - number of bars to calculation of the Slow (Long) Channel
Fast Channel Bar - number of bars to calculation of the Fast (Short) Channel
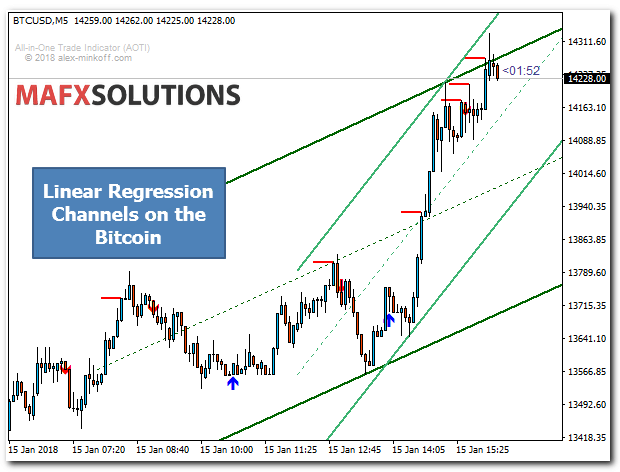
Be careful when you working with the channels of linear regression. Channels tend to follow the price, so it is important to use additional filters.
![]()
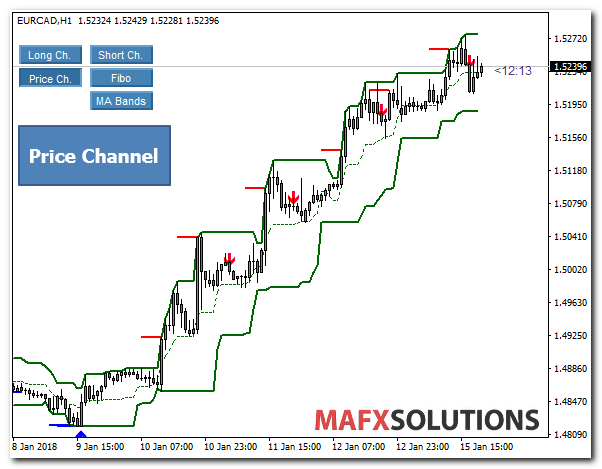
Price Channel Settings
Price Channel Period – period of the Price Channel
For Example:
![]()
Fibonacci Levels
Fibo Levels Bars for Count – the number of bars for Fibo Levels calculation
![]()
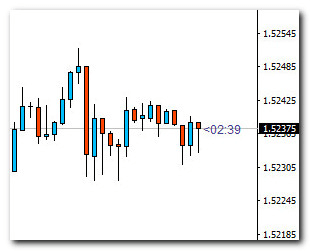
Candle Countdown Settings
Show Candle Countdown – Enable/Disable the Candle Countdown
Countdown Font Size – size and color of the countdown.
![]()
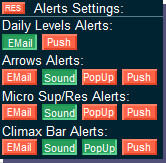
>>> Alerts Settings
Alert Sound - name of the sound notification file
Daily Levels Email Alert, Daily Levels Send Notifications
Arrows Email Alert, Arrows Sound Alert, Arrows Pop-up Alert, Arrows Send Notifications
Sup/Res Lines Email Alert, Sup/Res Lines Sound Alert, Sup/Res Lines Pop-up Alert, Sup/Res Lines Send Notifications
Climax Bar Email Alert, Climax Bar Sound Alert, Climax Bar Pop-up Alert, Climax Bar Send Notifications
These settings are available in the quick settings panel:
![]()
>>> Other Settings
![]()
You can use the control buttons without opening the indicator settings!
![]()
![]() All-in-One Trade Indicator (AOTI) Link
All-in-One Trade Indicator (AOTI) Link
![]()
Catalog of articles about the All-in-One Trade Indicator (AOTI) and AOTI-EA-Assistant (AEA) for it:

Read Here: https://www.mql5.com/en/blogs/post/734831
![]()
Good Luck & Big Profits!


