

Moving Average - MA
What is a 'Moving Average - MA'
A moving average (MA) is a widely used indicator in technical analysis that helps smooth out price action by filtering out the “noise” from random price fluctuations. It is a trend-following, or lagging, indicator because it is based on past prices.
The two basic and commonly used moving averages are the simple moving average (SMA), which is the simple average of a security over a defined number of time periods, and the exponential moving average (EMA), which gives greater weight to more recent prices. The most common applications of moving averages are to identify the trend direction and to determine support and resistance levels. While moving averages are useful enough on their own, they also form the basis for other technical indicators such as the Moving Average Convergence Divergence (MACD).
BREAKING DOWN 'Moving Average - MA'
A moving average (MA) is calculated in different ways depending on its type.
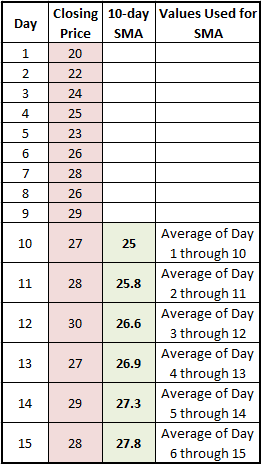
Let's look at a simple moving average (SMA) of a security with the following closing prices over 15 days:
Week 1 (5 days) – 20, 22, 24, 25, 23
Week 2 (5 days) – 26, 28, 26, 29, 27
Week 3 (5 days) – 28, 30, 27, 29, 28
A 10-day moving average would average out the closing prices for the first 10 days as the first data point. The next data point would drop the earliest price, add the price on day 11 and take the average, and so on as shown below.
How to Use Moving Averages
Moving averages lag current price action because they are based on past prices; the longer the time period for the moving average, the greater the lag. Thus, a 200-day MA will have a much greater degree of lag than a 20-day MA because it contains prices for the past 200 days. The length of the moving average to use depends on the trading objectives, with shorter moving averages used for short-term trading and longer-term moving averages more suited for long-term investors. The 50-day and 200-day MAs are widely followed by investors and traders, with breaks above and below this moving average considered to be important trading signals.
Moving averages also impart important trading signals on their own, or when two averages cross over. A rising moving average indicates that the security is in an uptrend, while a declining moving average indicates that it is in a downtrend. Similarly, upward momentum is confirmed with a bullish crossover, which occurs when a short-term moving average crosses above a longer-term moving average. Downward momentum is confirmed with a bearish crossover, which occurs when a short-term moving average crosses below a longer-term moving average.
Simple Moving Average - SMA
A simple moving average (SMA) is an arithmetic moving average calculated by adding the closing price of the security for a number of time periods and then dividing this total by the number of time periods.
As shown in the chart above, many traders watch for short-term averages to cross above longer-term averages to signal the beginning of an uptrend. Short-term averages can act as levels of support when the price experiences a pullback.
BREAKING DOWN 'Simple Moving Average - SMA'
A simple moving average is customizable in that it can be calculated for a different number of time periods, simply by adding the closing price of the security for a number of time periods and then dividing this total by the number of time periods, which gives the average price of the security over the time period. A simple moving average smoothes out volatility, and makes it easier to view the price trend of a security. If the simple moving average points up, this means that the security's price is increasing. If it is pointing down it means that the security's price is decreasing. The longer the timeframe for the moving average, the smoother the simple moving average. A shorter-term moving average is more volatile, but its reading is closer to the source data.
Analytical Significance
Moving averages are an important analytical tool used to identify current price trends and the potential for a change in an established trend. The simplest form of using a simple moving average in analysis is using it to quickly identify if a security is in an uptrend or downtrend. Another popular, albeit slightly more complex analytical tool, is to compare a pair of simple moving averages with each covering different time frames. If a shorter-term simple moving average is above a longer-term average, an uptrend is expected. On the other hand, a long-term average above a shorter-term average signals a downward movement in the trend.
Golden Cross
The golden cross is a bullish breakout pattern formed from a crossover involving a security's short-term moving average (such as the 15-day moving average) breaking above its long-term moving average (such as 50-day moving average) or resistance level. As long-term indicators carry more weight, the golden cross indicates a bull market on the horizon and is reinforced by high trading volumes.
BREAKING DOWN 'Golden Cross'
There are three stages to a golden cross. The first stage requires that a downtrend eventually bottoms out as selling is depleted. In the second stage, the shorter moving average forms a crossover up through the larger moving average to trigger a breakout and confirmation of trend reversal. The last stage is the continuing uptrend for the follow through to higher prices. The moving averages act as support levels on pullbacks, until they crossover back down at which point a death cross may form. The death cross is the opposite of the golden cross as the shorter moving average forms a crossover down through the longer moving average.
Applications of the Golden Cross
The most commonly used moving averages are the 50-period and the 200-period moving average. The period represents a specific time increment. Generally, larger time periods tend to form stronger lasting breakouts. For example, the daily 50-day moving average crossover up through the 200-day moving average on an index like the S&P 500 is one of the most popular bullish market signals. With a bell weather index, the motto "A rising tide lifts all boats" applies when a golden cross forms as the buying resonates throughout the index components and sectors.

![]()


