

25.10.2017
CAD/CHF DAILY CHART
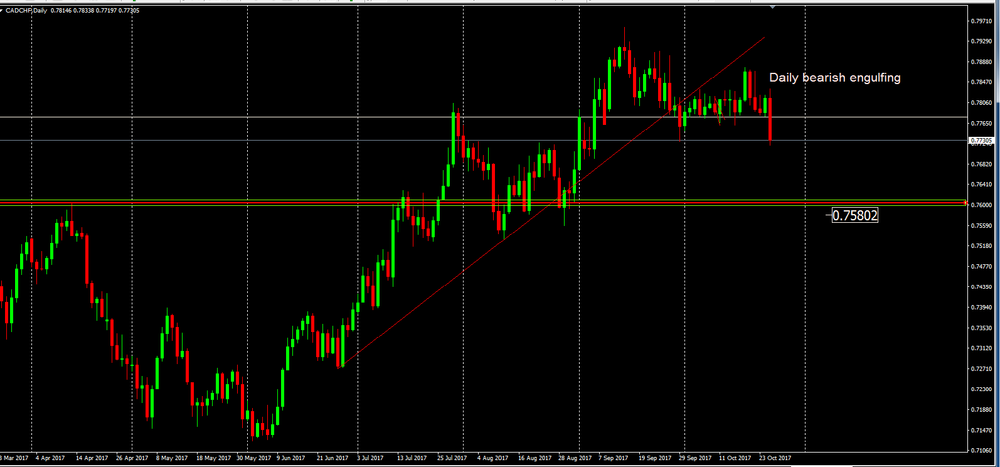
As we can see on a daily chart, the trend line that has been respected for several days has recently been broken.
However, and after the breakout or price ended by entering into consolidation.
If the daily candle closes like this or similar, then we might have the confirmation of a pattern of candles ("Bearish Engulfing") in which it will give some indications of beginning of a new bearish tendency.
In a bearish scenario, we might see the price going down until close to 0.7580.
Please follow us on our website www.realtrader.org and Facebook.
Real Trade Customer Support
E-mail: info@realtrader.org


