
As reported on Tuesday by the American Petroleum Institute (API), oil reserves in the US last week rose by 0.5 million barrels. At the same time, stocks of gasoline and distillates dropped quite significantly: -5.8 million barrels and -4.9 million barrels, respectively.
Oil prices positively received this information after the prices rose during yesterday's trading day. The price for Brent crude oil rose by 1.7% on Tuesday to 58.27, adding about $ 1 per barrel. Brent crude futures for ICE increased by 1.7%, to 58.33 dollars per barrel.
On Tuesday, the Saudi Arabian Oil Minister confirmed his intention to do everything necessary to reduce the world's oil reserves to an average of 5-year level.
Last year, OPEC and a number of countries outside the cartel agreed on a total reduction in production of 1.8 million barrels per day. Now it is expected that at the November meeting the participants in the OPEC deal, which currently operates until the end of the first quarter of 2018, will again extend it. Oil prices also are supported by the dynamics of demand. Oil imports to India last month rose to a new high of 4.6 million barrels a day. China imported 37 million tons of oil in September (9% more than in August and 12% more in annual terms).
Analysts of the oil market forecast an even higher import of oil to Asian countries, in particular, to China and India.
Today, investors will wait for a weekly report on US reserves and oil production from the US Energy Ministry, which will be published at 14:30 (GMT). It is expected that oil and oil products stocks decreased by 2.578 million barrels last week, after a decrease of 5.731 million barrels the week before last. If the data is confirmed, the positive dynamics of oil prices will continue.
*)An advanced fundamental analysis is available on the Tifia Forex Broker website at tifia.com/analytics
Support and resistance levels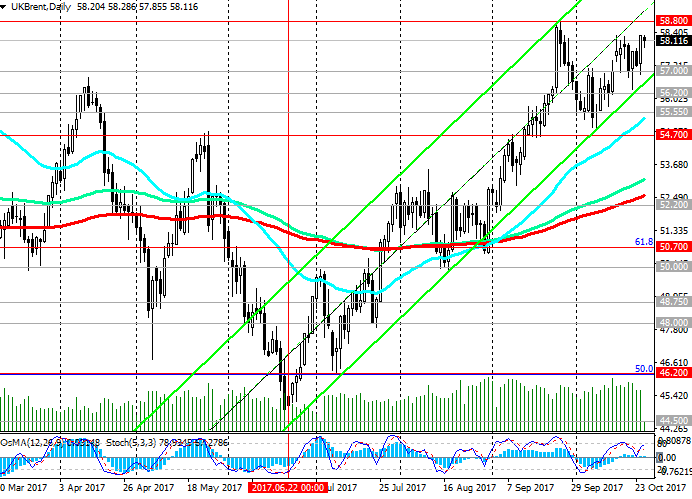
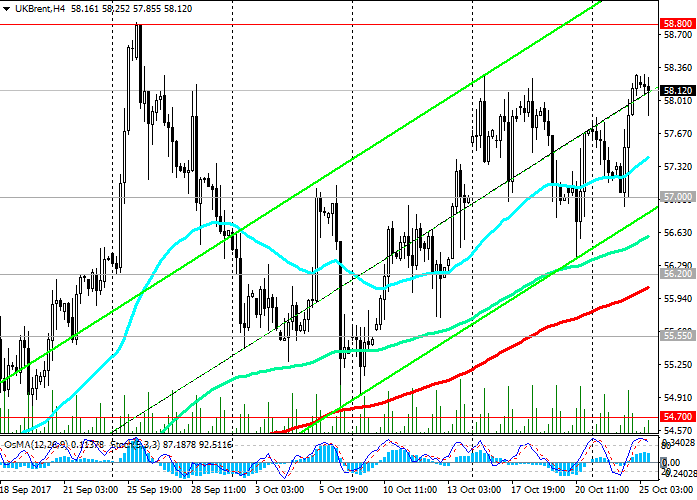
At the beginning of today's trading session, Brent crude is trading in a narrow range near the level of $ 58.10 per barrel.
The price is rising in the ascending channel on the daily chart, the upper limit of which passes near the level of 60.00. In the event of a breakdown of the nearest resistance level of 58.80 (September highs), the target of further growth will be the resistance level of 61.50 (EMA144 on the monthly chart).
While the price is above the key support level of 54.70 (EMA200 on the weekly chart), long positions remain relevant.
The signal for the development of an alternative scenario to decline will be a breakdown of the support level of 57.00 (the bottom line of the ascending channel on the daily chart).
If the price returns to 54.70, the risks of resuming the downtrend increase with targets at 52.20 (EMA200 on the daily chart), 50.70 (the Fibonacci level 61.8% correction to the decline from the level of 65.30 from June 2015 to the absolute minimums of 2016 near the mark of 27.00), 50.00 (the lows of August), 48.75, 48.00, 46.20 (50% Fibonacci level), 44.50 (the lows of the year), 41.70 (the Fibonacci level of 38.2%).
Technical indicators (OsMA and Stochastic) on the daily, weekly, monthly charts are on the buyers side.
Long positions are preferred.
Support levels: 58.00, 57.00, 56.20, 55.55, 55.00, 54.70, 53.75, 52.20, 50.70, 50.00
Resistance levels: 58.80, 60.00, 61.50
Trading Scenarios
Sell Stop 57.75. Stop-Loss 58.30. Take-Profit 57.00, 56.20, 55.70, 55.30, 54.70, 53.75, 52.20, 50.70
Buy Stop 58.30. Stop-Loss 57.75. Take-Profit 58.80, 59.00, 60.00, 61.50
*) For up-to-date and detailed analytics and news on the forex market visit Tifia Forex Broker website tifia.com


