
After the active growth the day before against the backdrop of a number of positive reports of companies about profits today
The main US stock indexes are declining. Yesterday, the S & P500 and Nasdaq 100, which became the leaders in growth this year, held their worst day in three weeks.
The sale of shares in technology companies pulled down not only the US, but also European and Asian stock indices. The European StoxxEurope600 Index dropped 0.9% at the beginning of trading. Shares of the US Company Amazon.com Inc., for example, yesterday fell significantly as the company reported a 77% drop in quarterly profits. Korean Kospi lost 1.7% during the Asian session, while the Australian S&P/ASX200 fell 1.4%.
Also, the dynamics of US indices were affected by the next setbacks of the US presidential administration. Attempts by the US Republican Party to repeal the Law on Affordable Medical Services have failed: a package of proposals to refuse part of the provisions of this law from 2010 was not supported in the Senate.
The US Department of Commerce today (12:30 GMT) will publish a preliminary estimate of GDP for the 2-nd quarter. It is expected that GDP in the US grew by 2.6% in the second quarter. If the data coincides with the forecast, they will confirm the economic recovery after the deterioration of the situation in the first three months of this year. This will support the stock indices. And vice versa. If the GDP data and the inflation indicators published simultaneously for the 2nd quarter are weaker than the forecast values, the stock indices will receive another portion of the negative and are likely to continue their decline.
*)An advanced fundamental analysis is available on the Tifia website at tifia.com/analytics
Support and resistance levels
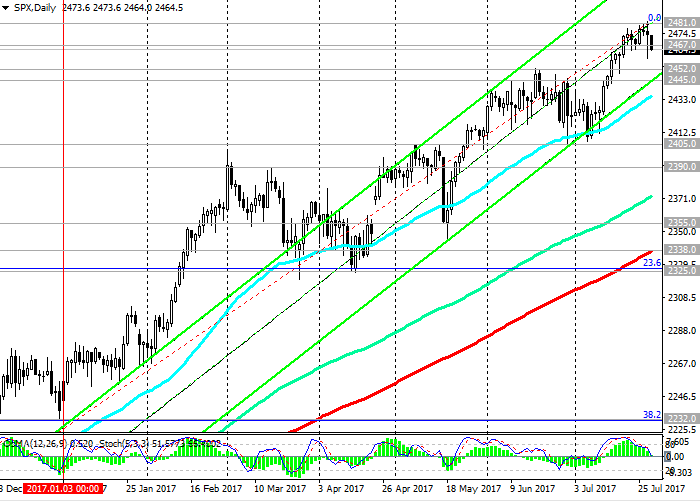
With the opening of today's trading day, the S & P500 index declined, continuing to develop short-term downward dynamics.
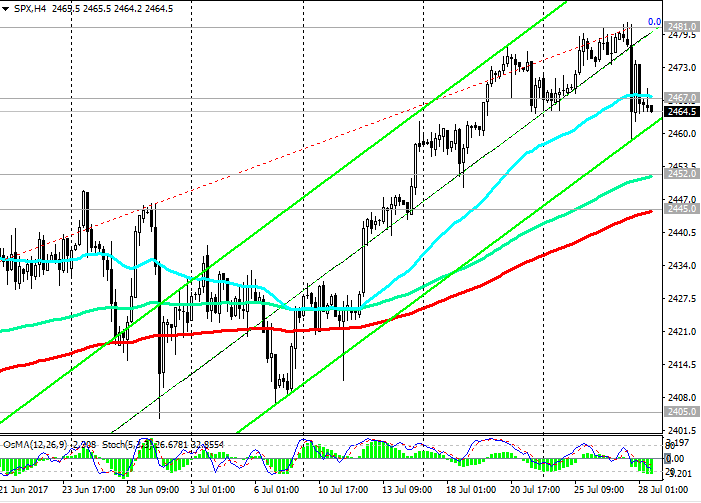
Indicators OsMA and Stochastics on the daily, 4-hour and 1-hour charts turned to short positions, indicating a downward correction after many days of growth.
The price broke through the short-term support level 2467.0 (EMA200 on the 1-hour chart, EMA50 on the 4-hour chart).
If the negative dynamics will increase, then an additional reduction of the index to the support levels 2452.0 (EMA144), 2445.0 (EMA200 on the 4-hour chart and the bottom line of the uplink on the daily chart) is possible. Deeper decline in the index is - to the support levels of 2405.0 (June and July lows), 2390.0, 2355.0, near which the bottom line of the rising channel passes on the weekly chart.
In general, the medium-term positive dynamics of the index remains. The index is growing, starting from February 2016 and trading in the upward channels on the daily and weekly charts.
While the price is above 2338.0 (EMA200 on the daily chart), 2325.0 (Fibonacci level of 23.6% correction to growth since February 2016), the positive dynamics of the index remains. In the case of the breakdown of the resistance level of 2481.0 (the highs of July and the year), the growth of the index will resume.
Support levels: 2452.0, 2445.0, 2405.0, 2390.0, 2355.0, 2338.0, 2325.0
Resistance levels: 2467.0, 2481.0
Trading Scenarios
Sell Stop 2461.0. Stop-Loss 2474.0. Objectives 2452.0, 2445.0, 2405.0, 2390.0, 2355.0, 2338.0, 2325.0
Buy Stop 2474.0. Stop-Loss 2461.0. Objectives 2481.0, 2490.0, 2500.00
*) For up-to-date and detailed analytics and news on the forex market visit Tifia company website tifia.com


