

After the unstable and insignificant growth last month, US stock indices seem to change their direction of movement and unfold "to the south."
Published yesterday, the minutes of the June meeting of the Federal Reserve confirmed the market expectations and intentions of the Fed on monetary policy in the US. The Fed, despite its weak inflation, plans to make another rate hike this year, as well as to start cutting its budget, which is estimated at about 4.5 trillion dollars by various estimates.
Today at 11:30 (GMT) the minutes of the June meeting of the European Central Bank are published, which may cause increased interest of investors in connection with the latest comments of ECB representatives. The focus of the markets today will be the question of the ECB's intentions regarding the beginning of the reduction of the incentive program in the coming months.
In recent days, investors have been focusing their attention on the comments of the leaders of the world's largest central banks. It seems that, amid the strengthening of the world economy, stimulating programs in countries with the largest economies may soon be curtailed. And this is a negative signal for world stock markets.
Today is a busy trading day. In addition to publishing information about the ECB monetary policy meeting, the US trade statistics published in the US trading session are statistics on private sector employment from ADP for June, the trade balance for May, the weekly report on primary applications for unemployment benefits and business activity indices for June . Weak indicators of macroeconomic indicators will cause a decline in the dollar and US stock indices.
Also at 14:00 (GMT), a member of the US Federal Open Market Committee, Jerome Powell, is expected to speak. It is likely that he will also support the Fed's actions towards a gradual tightening of monetary policy in the United States.
*)An advanced fundamental analysis is available on the Tifia website at tifia.com/analytics
Support and resistance levels
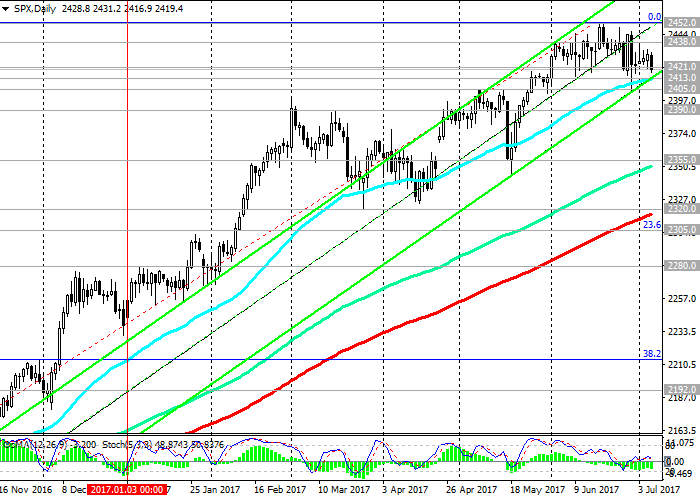
With the opening of today's trading day and, especially, during the European trading session, the S&P500 index is actively declining. The price fell below the 2422.0 mark, corresponding to the closing price of the previous month. If the negative trend increases, then July will be the first month in which the S & P500 index will close in negative territory after an 8-month active growth.
The index has already broken through an important short-term support level of 2421.0 (EMA200 on the 4-hour chart) and is aiming for the support level of 2413.0 (EMA50 and the bottom line of the uplink on the daily chart). If the negative trend is to increase, then the following goals of the S & P500 index decline will be support levels 2405.0, 2390.0, 2355.0, between which the lower line of the uplink on the weekly chart passes, 2320.0 (EMA200 on the daily chart), 2305.0 (Fibonacci level 23.6% correction to Growth since February 2016). The breakdown of support levels 2320.0, 2305.0 will cancel the bullish trend of the index.
Indicators OsMA and Stochastics on the 4-hour, daily, weekly charts have already turned to short positions.
While the price is above the level of 2413.0, we can speak of a downward correction of the index. Its positive dynamics is higher than this level. In case of resumption of growth and after the breakdown of resistance level 2452.0 (June and year highs), the growth of the index will resume.
Support levels: 2413.0, 2405.0, 2390.0, 2355.0, 2320.0, 2305.0
Resistance levels: 2438.0, 2453.0
Trading Scenarios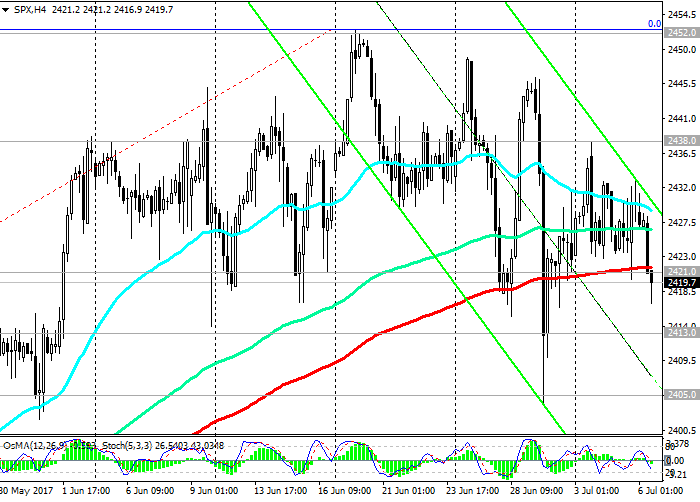
Sell in the market. Stop-Loss 2432.0. Objectives 2413.0, 2405.0, 2390.0, 2355.0, 2320.0, 2305.0
Buy Stop 2432.0. Stop-Loss 2417.0. Objectives 2438.0, 2450.0, 2500.00
*) For up-to-date and detailed analytics and news on the forex market visit Tifia company website tifia.com


