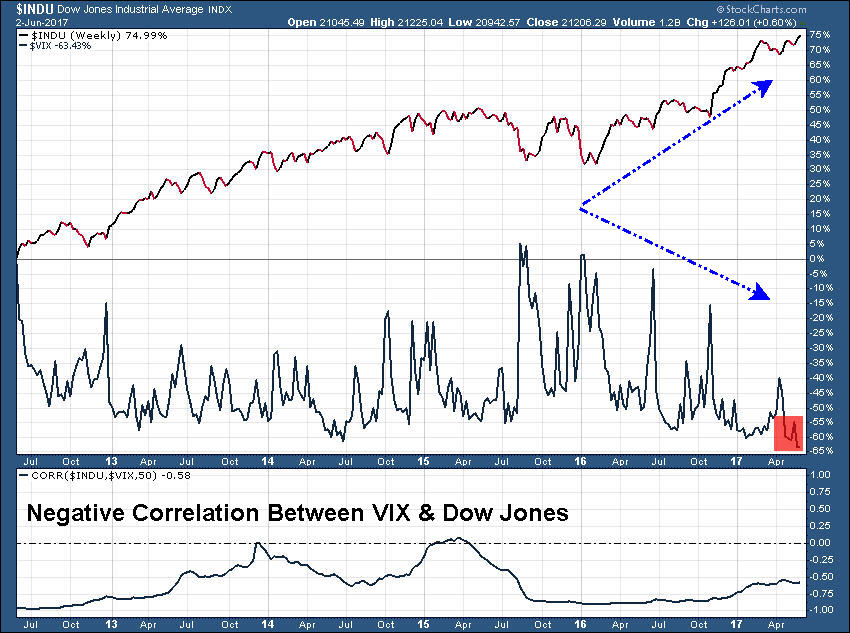
This is a performance chart for the Dow Jones Industrial and VIX. The chart show 5 years of historical performance.
The correlation index between VIX & Dow Jones show negative reading most of the time, which mean that VIX move against Dow Jones. When VIX spike the Dow Jones fall in a downtrend, and when VIX fall the Dow Jones rise.
Through the last 5 years, VIX lost 63% from its value, but Dow Jones gained +75%.
VIX now reached a 25 years low, and Dow Jones is at all times high.
I expect to see a strong move in Dow Jones that reach to unexpected price values before any signs for change in the current trend.