Crude Oil Price Forecast: Selling Intensifies on OPEC Discord
Talking Points:
- Crude Oil Technical Strategy: Break Of Triangle Support ($51-$49/bbl) Turns Focus Lower
- OPEC Member Refusals Put Pressure on Oil Price & Doubt on OPEC Deal
- Baker Hughes Rig Count Declines For First Time Since June
Welcome to my products:
https://www.mql5.com/en/users/soubra2003/seller
The price of Crude Oil looks to be heading for a weekly decline as recent reports show OPEC is not getting closer to reaching a consensus about freezing output. On Friday, word came out via Dow Jones that Iraq & Iran were both refusing to freeze output, which isn’t good since the accord is looking for a cut of production as opposed to freezing at current levels. The main argument Iraq & Iran seem to have is that OPEC is underestimating their production. This discord among nearly 25% of monthly estimated OPEC Crude Production (Iraq at 13.5% & Iran at 10.8%) is enough to pull the price of Oil below $49 toward the close of trading on Friday.
Beyond the disharmony among OPEC members, there were two data points about the supply of Oil within the United States. First, Baker Hughes Rig Count declined for the first time since June. The U.S. Oil Rig Count fell from 441 to 439. In addition to the small change in active U.S. Oil Rigs, Exxon Mobil noted that they believe the worldwide oil oversupply and low prices that currently face the market will continue through well into 2017.
H4 Crude Oil Price Chart: Price Breaking Below Triangle Support Turns Focus Lower In Short-Term
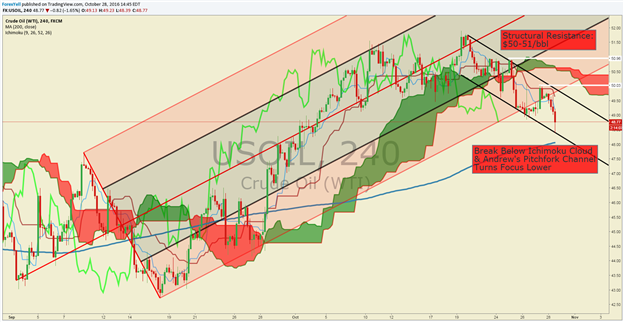
Both Andrew’s Pitchfork & Ichimoku are designed to help a trader understand the forest for the trees. The forest being the trend and the individual trees being the intra-week trading opportunities. The trend on a 240-minute Crude Oil chart shows a lowerbias as price and momentum have broken the Ichimoku Cloud, and the price has broken below the lowerparallel line of the Andrew’s Pitchfork. Both indicators are showing us that the Bullish structure is broken.
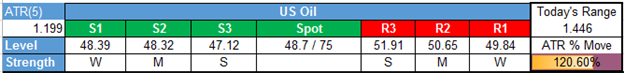
In our last note, we shared how the 38.2% retracement at $49/bbl would need to hold for the hope of asmallcorrection preceding a trend resumption. That hope looks dashed on the recent headline above, and that moves our downside targets towards the 50% & 61.8% Fibonacci retracement of the September 27 to October 19 price range at $48.04 & $47.12/bbl respectively.
A break above structural resistance of the presumed-corrective move lower at $50, and $51 would be needed to turn us Bullish again. Until the break of resistance surfaces, we’ll be anticipating a move downtoward $47.12/bbl. The burden of proof is now on the Bulls, and we’ll continue to doubt their arguments if the price of Oil to fails surpass $50-51/bbl before anticipating new 15-month highs anytime soon.
Key Levels Over the Next 48-hrs of Trading As of Friday, October 28,2016