WTI Crude Oil Price Forecast: Faltering Below Price Resistance Raises Sub-$40 Fears

Talking Points:
- Crude Oil Technical Strategy: Favoring Downside < $45/bbl
- Intermarket Analysis Shows US Dollar Within A Whisper Of A Breakout
- Sentimental Trading System Shows The Trend May Be Reversing
The price of WTI Crude Oil (CFD: USOil) traded at its lowest levels in two months this week as the Crude rally looks less sustainable than the equity rally that recently saw the SPX500 reach lifetime highs this week. Weekly demand numbers have been encouraging as the draws from US aggregate inventory continue and the stock in Cushing, OK depletes further. However, one new data point is far from encouraging for Oil Bulls:
Recent reports show the short-term floating storage is sitting (pun intended) at its highest level since 2009 per the IEA July Oil Market Report. Bloomberg recently noted that ~9 million barrels of crude were stored off the coast of the North Sea in the UK, which was a significant jump of ~7 million barrels in May. Much of this can be blamed on weak demand in Europe.
For this reason, we encourage you to keep an eye on increasing supply in H2 2016, and whether or not supply will be met with sufficient demand. In addition to the rise of Floating Oil Storage, one important fundamental story to keep an eye on before we get to the charts is the increase in exports from Russia.
According to Oil Exports, Russia may be the new OPEC in terms of threatening the recovery or adding to the supply glut that never fully went away. Since July 2014, Russia’s shipments have increased, and their YoY shipments have increased 4.9%.
That being said, we could be seeing a new wave of supply coming onto the market, and if demand cannot keep up (which the storage on Oil tankers argues it cannot), we could move lower. To explain how much lower, let’s move on to the charts.
As US Dollar Rests Below Resistance, Watch Weekly Pivot Levels on USOil
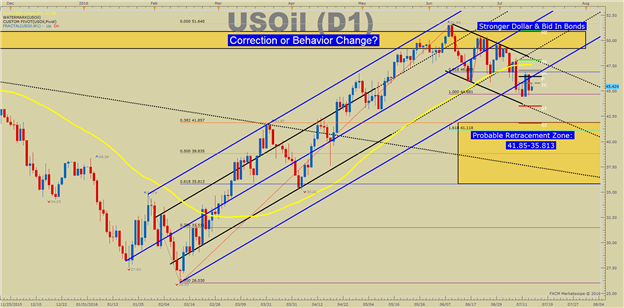
We’ve long been a fan of the 55-Day Moving Average as a rudder on medium-term Crude Oil directional bias. Currently, Oil is trading below the 55-DMA that sits at $47.60/bbl. The Fibonacci-Sequence Based Moving Average had held as safe support for nearly four months, but recently it broke. Last week’s strong break could prove significant. For now, we will use the 55-DMA as resistance as we brace for a move lower. A stronger US Dollar would likely exacerbate that move.
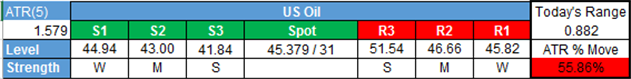
As of mid-day Thursday, the price of USOil is looking comfortable below the Weekly Pivot at $46.42/bbl. Traders can continue to watch their charts to see if the price can surmount the Weekly Pivot, and begin to use it as support. If not, the downside could be upon us. For swing traders looking lower, they should keep an eye on the Weekly S1 & S2 at $43.50/bbl and $41.85/bbl respectively.
A move toward the S2 at $41.85/bbl would open up the scenario of further weakness toward the 38.2%-61.8% retracement zone of the February-June rally. This zone is around $41.85-$35.81/bbl. US Dollar strength would hasten such a move. Monday has seen a risk-on move with S&P500 (CFD: SPX500) trading at lifetime highs intraday, but Oil does not appear to have received the risk-on message yet.
In addition to the 55-DMA acting as resistance, if the price can break above $47.60/bbl we would be quick to focus on the current June high of $51.64/bbl. There is a lot of resistance in the $51/bbl region such as the 100% Fibonacci extension move off the February low and the October 2015 higher. Given the macro and technical backdrop, it will be a tough one to break.
Bottom Line:
The pullback we’ve seen is not surprising, but unfortunately, the evidence is building that we could see downside acceleration. Furthermore, if we break above the ~$51 resistance level, a stronger break toward the next key resistance level ~$60 could be underway. For now, be on the watch for further US Dollar strength that would continue to pressure the price of Oil down to the 38.2%-61.8% retracement zone of the February-June rally.
Contrarian System Warns of Further Downside As of 7/14/16
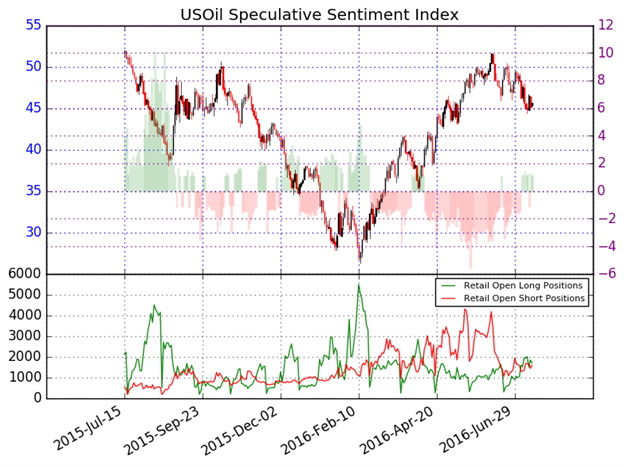
In addition to the technical focus around multiple support-zones, we should keep an eye on retail sentiment, which favors more downside price action. Further downside is currently aligned with our Speculative Sentiment Index or SSI for now.
As of mid-day Thursday, the ratio of long to short positions in the USOil stands at 1.07, as 52% of traders are long. Yesterday the ratio was 1.18; 54% of open positions were long. Long positions are 3.6% lower than yesterday and 19.0% below levels seen last week. Short positions are 5.9% higher than yesterday and 23.2% above levels seen last week.
We use our SSI as a contrarian indicator to price action, and the fact that the majority of traders are long gives a signal that the USOil may continue lower. The trading crowd has grown less net-long from yesterday but unchanged since last week. The combination of current sentiment and recent changes gives a further mixed trading bias.
Key Levels Over the Next 48-hrs of Trading As of Monday, July 14, 2016