Analysis GBP/USD - FXStreet
GBP/USD Current price: 1.4490

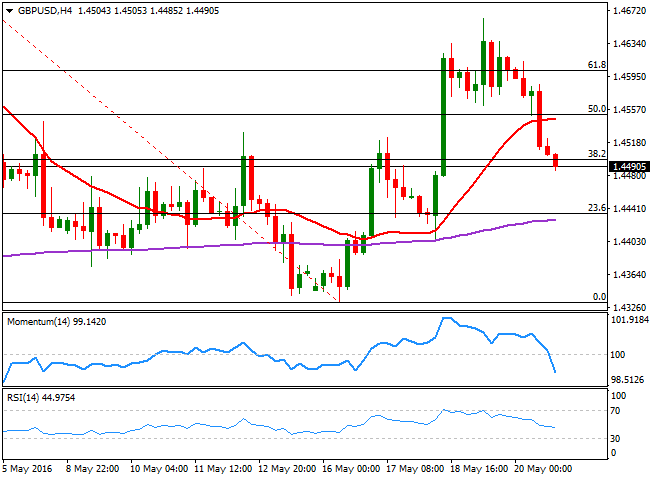
The enthusiasm over avoiding a possible Brexit began to fade on Friday, following a new poll that showed that the "leave" vote is slightly ahead of the "remain" vote, putting the Pound under selling pressure. Adding to broad dollar's strength, the GBP/USD pair fell down to 1.4490, where it closed the week, holding however, in to gains. The UK will release its preliminary Q1 GDP figures next Thursday, expected around 0.4%. A disappointing reading should lead to further slides towards the 1.4330 region in the pair, this month low, en route to 1.4250, a major static support. Technically, the daily chart shows that this week's rally reached the 61.8% retracement of the 1.4769/1.4332 slide, and that the technical indicator have turned lower around their mid-lines, as the price hovers around a flat 20 SMA indicating an increasing bearish potential for the upcoming days. In the shorter term, the 4 hours chart presents a strongly bearish Momentum, while the RSI indicator heads south around 44 and the price stands around the 38.2% retracement of the mentioned daily decline, also in line with a bearish continuation.
Support levels: 1.4460 1.4425 1.4380
Resistance levels: 1.4530 1.4570 1.4610


