Technical Analysis of Gold for April 26, 2016
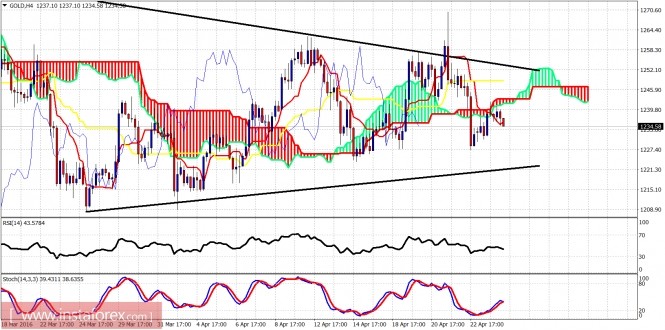
Gold still remains inside the triangle pattern and there is no clear direction in the gold market right now. There are more chances of a deeper correction at least towards $1,190 but sellers still struggle to gain control of the trend.

Black lines - triangle pattern
Gold reached the 4-hour Kumo (cloud) resistance yesterday and got rejected. The price remains inside the triangle pattern but still under the critical resistance of $1,260-70. Support is at $1,220. The next level to be seen if support fails to hold is at $1,190.

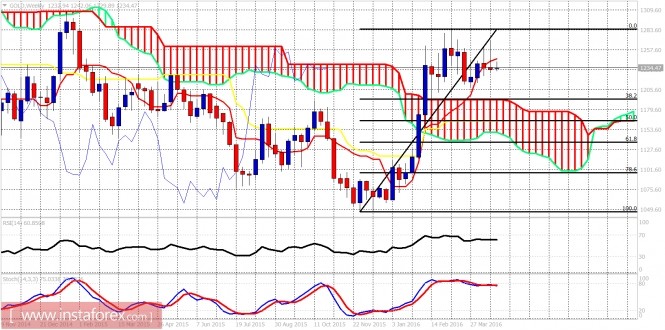
The weekly chart remains bearish as the price is under the tenkan-sen (red line indicator) and this implies that soon we should see a move towards the first important weekly support at $1,190 where we also find the 38% Fibonacci retracement. I would not rule out a deeper correction even towards $1,140.
The material has been provided by InstaForex Company - www.instaforex.com


