

SPX500: Bull Flag Ahead of US Earnings Kick-Off
Talking Points:
S&P 500 Technical Strategy: Flat. Conditional long + short setups identified.
US stock prices remain well-supported while European and Japanese equities are putting in more divergent reads.
If you’re looking for trading ideas, check out our Trading Guides. And if you want something more short-term in nature, check out our SSI indicator.
One of the most pertinent takeaways from the first quarter was the miraculous turn-around that was seen in risk assets in the second half of the quarter. After spending much of January and the first half of February in a very precarious state, the post-Yellen rally that started on the morning of February 11th brought in a significantly different tone in price action across markets. Oil prices recovered, the US Dollar weakened significantly and, perhaps most notably, US stocks went on a rip-roaring run higher that saw a > 15% pop in less than 8 weeks.
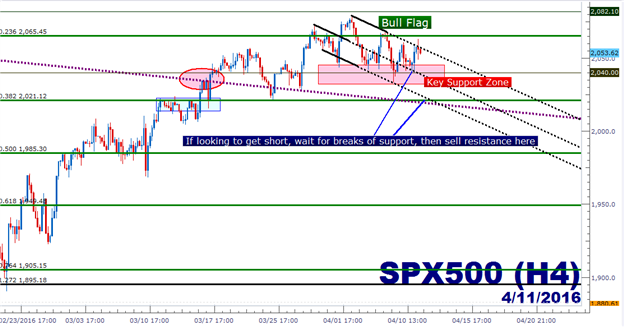
The big question is one of sustainability, as ‘normal’ markets don’t usually just find 15% in two months. Either the drama from the early part of the year was overblown, or investors are in for a rude awakening through the remainder of the year. European and Japanese stocks have been far more subdued, so the latter of those two options would appear more likely if reading the tea leaves; but with a chart nearby traders don’t need to resort to such devices. The current setup on the S&P is one of strength after this 15% run, and over the past week we’ve seen a down-ward sloping channel that’s begun to develop. Given the prior up-trend, this downward sloping channel would make for a ‘bull flag’ formation.
But to add a little bit more context, we’re sitting in front of what is probably the biggest driver of equity prices; and that is earnings. After today’s equity market close, we’ll hear from Alcoa (ticker: AA) to kick-off earnings for this quarter. Throughout the week, we’ll hear from quite a few banks with JP Morgan reporting on Wednesday, followed by Bank of America and Wells Fargo on Thursday.
So we’re certainly nearing a time in which stock prices can put in some movement. The current setup would be looking to a familiar level at 2,040, which was a persistently strong support level throughout much of last year. Traders can look to buy support at this level with a relatively tight stop to look for up-trend continuation. Targets could be accorded to 2,065.45 (23.6% Fibonacci level from the 2,137-1,833.50 move), followed by 2082.10 (December double-top), and 2,100 (major psychological level).
However, should support at 2,040 give way, traders may have the potential to look for reversal setups in the S&P. If this takes place, traders should look to sell resistance at previous support levels. The price of 2,040 could function for this regards, as could 2,021.12, which is the 38.2% Fibonacci retracement of the move mentioned earlier. Should these levels become violated, the near-term support structure in the S&P would be broken, and traders can look to play trend-continuation strategies lower.


")